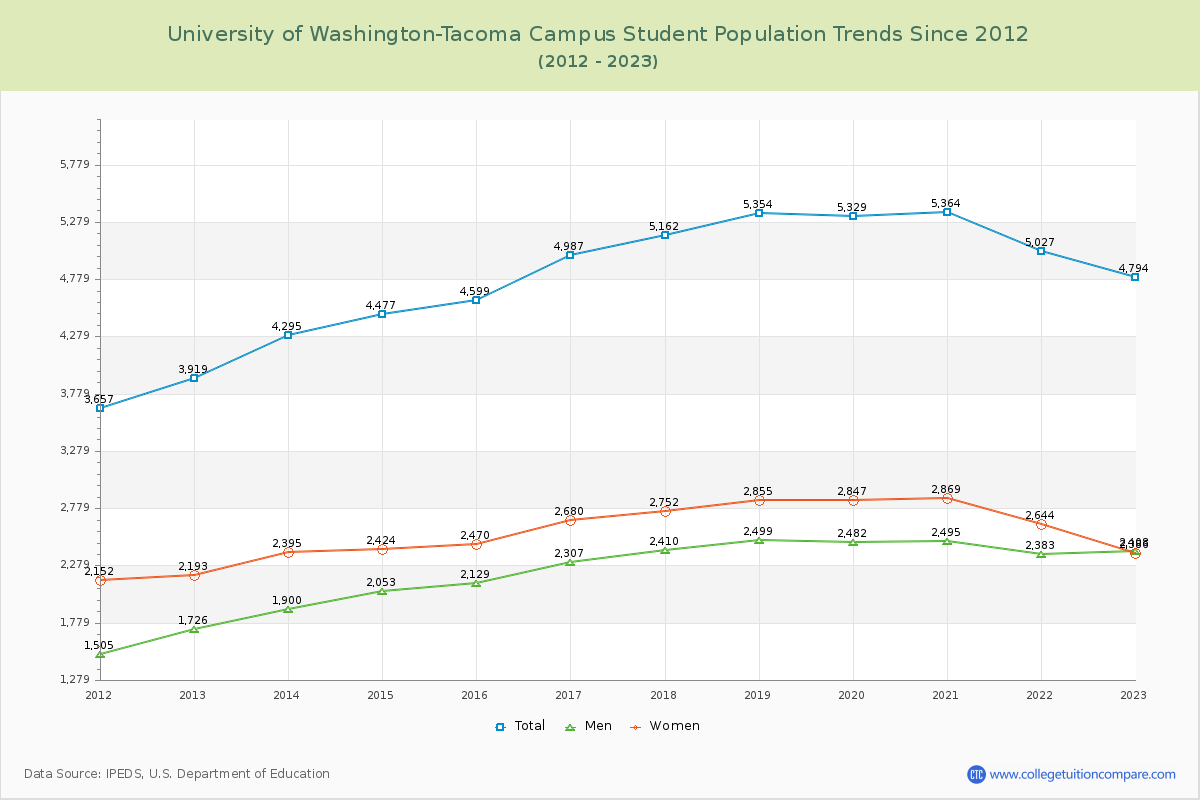
Student Population Changes
The average student population over the last 12 years is 4,846 where 4,794 students are attending the school for the academic year 2022-2023.
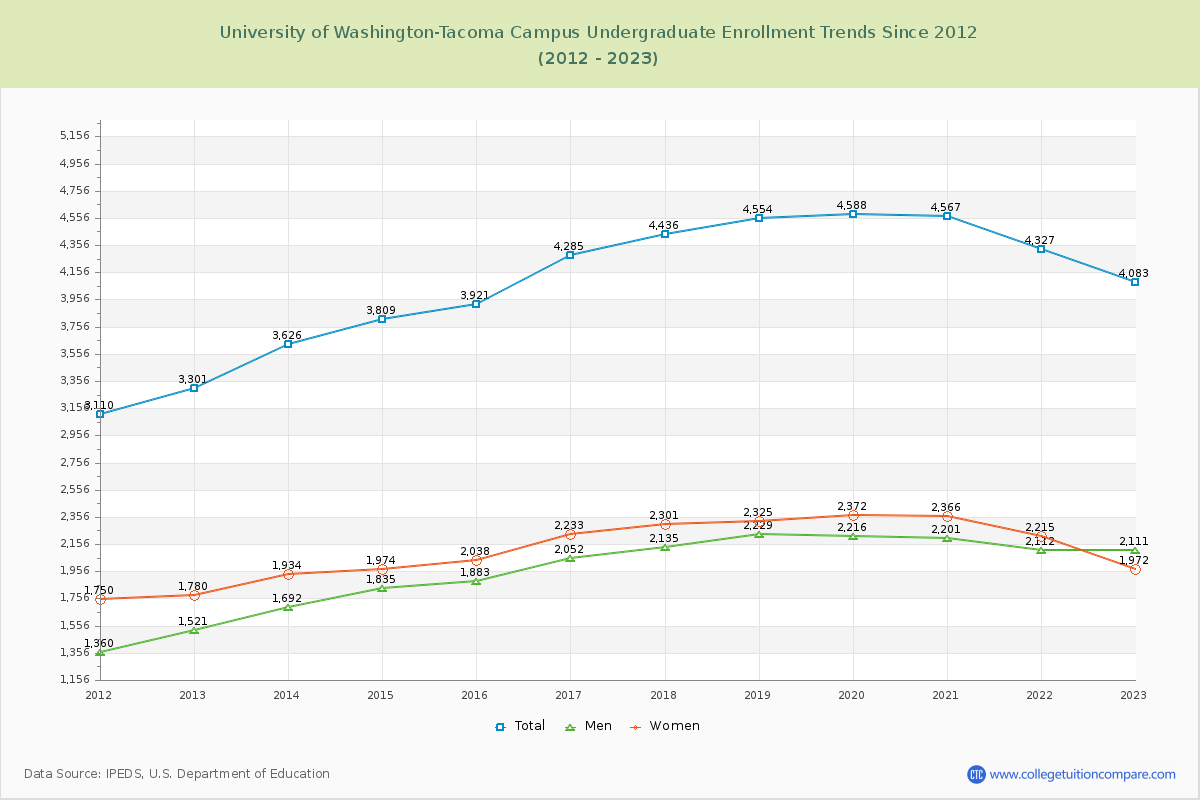
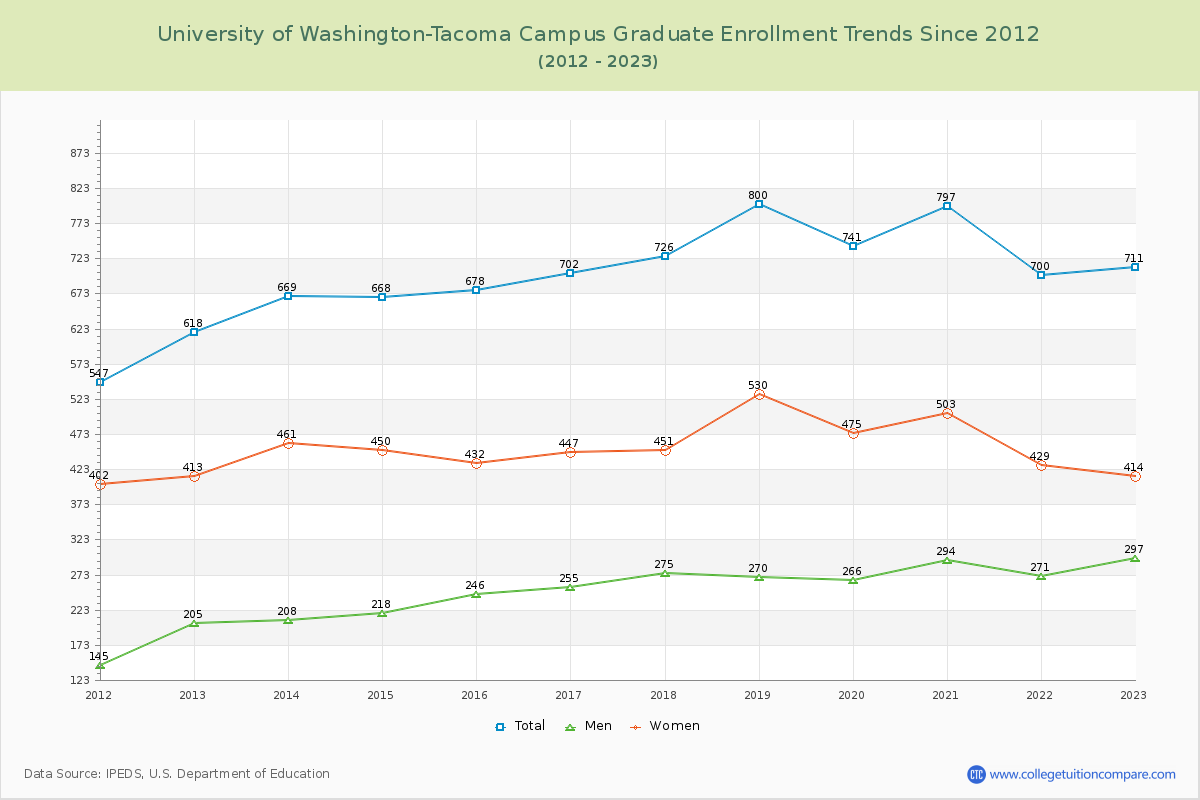
85.17% of total students is undergraduate students and 14.83% students is graduate students. The number of undergraduate students has increased by 782 and the graduate enrollment has increased by 93 over past 10 years.
The female to male ratio is 0.99 to 1 and it means that there are similar numbers of female and male students enrolled in UWT.
The following table and chart illustrate the changes in student population by gender at University of Washington-Tacoma Campus since 2012.
| Year | Total | Undergraduate | Graduate | ||||
|---|---|---|---|---|---|---|---|
| Total | Men | Women | Total | Men | Women | ||
| 2012-13 | 3,919 | 3,301 | 1,521 | 1,780 | 618 | 205 | 413 |
| 2013-14 | 4,295 376 | 3,626 325 | 1,692 171 | 1,934 154 | 669 51 | 208 3 | 461 48 |
| 2014-15 | 4,477 182 | 3,809 183 | 1,835 143 | 1,974 40 | 668 -1 | 218 10 | 450 -11 |
| 2015-16 | 4,599 122 | 3,921 112 | 1,883 48 | 2,038 64 | 678 10 | 246 28 | 432 -18 |
| 2016-17 | 4,987 388 | 4,285 364 | 2,052 169 | 2,233 195 | 702 24 | 255 9 | 447 15 |
| 2017-18 | 5,162 175 | 4,436 151 | 2,135 83 | 2,301 68 | 726 24 | 275 20 | 451 4 |
| 2018-19 | 5,354 192 | 4,554 118 | 2,229 94 | 2,325 24 | 800 74 | 270 -5 | 530 79 |
| 2019-20 | 5,329 -25 | 4,588 34 | 2,216 -13 | 2,372 47 | 741 -59 | 266 -4 | 475 -55 |
| 2020-21 | 5,364 35 | 4,567 -21 | 2,201 -15 | 2,366 -6 | 797 56 | 294 28 | 503 28 |
| 2021-22 | 5,027 -337 | 4,327 -240 | 2,112 -89 | 2,215 -151 | 700 -97 | 271 -23 | 429 -74 |
| 2022-23 | 4,794 -233 | 4,083 -244 | 2,111 -1 | 1,972 -243 | 711 11 | 297 26 | 414 -15 |
| Average | 4,846 | 4,136 | 1,999 | 2,137 | 710 | 255 | 455 |