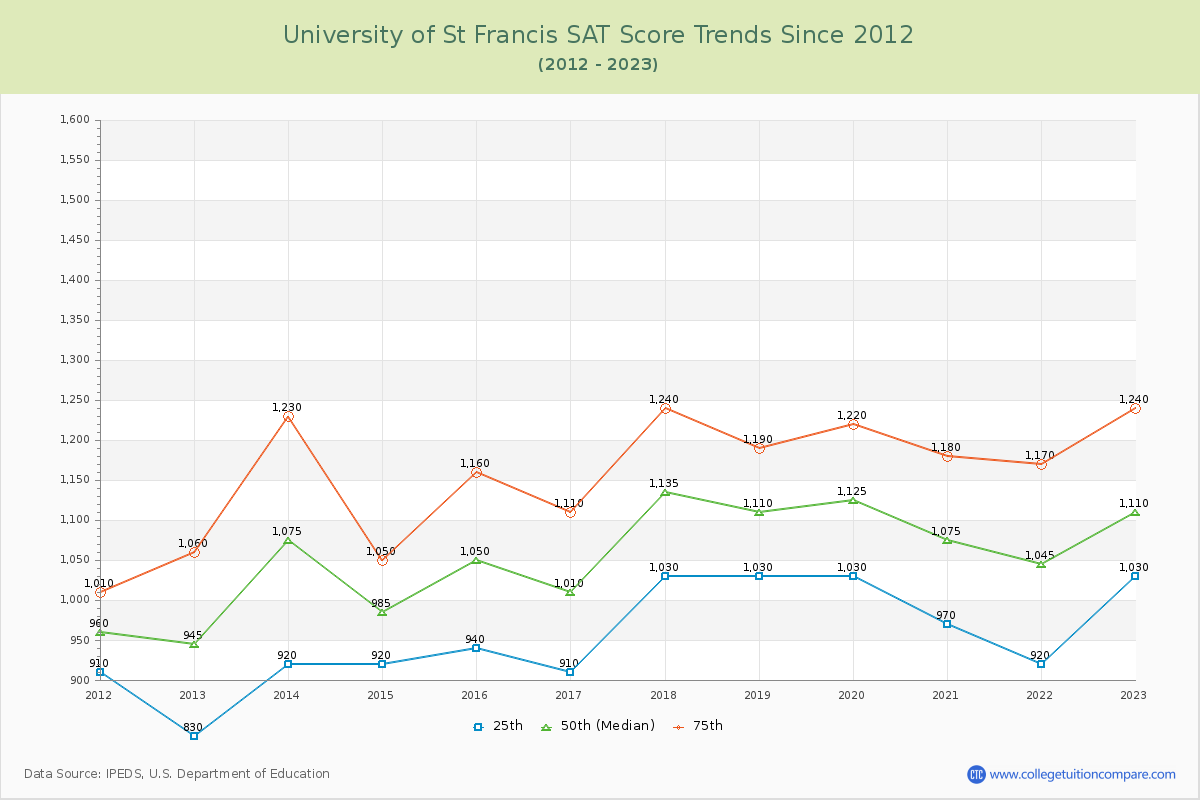
SAT Scores Over Time
The 2023 SAT score is 1110 at U of St Francis. Over the past 12 years, the average SAT score is 957 (25th percentile) and 1168 (75th percentile). Compared to similar schools, the submitted SAT scores are around national average at U of St Francis.
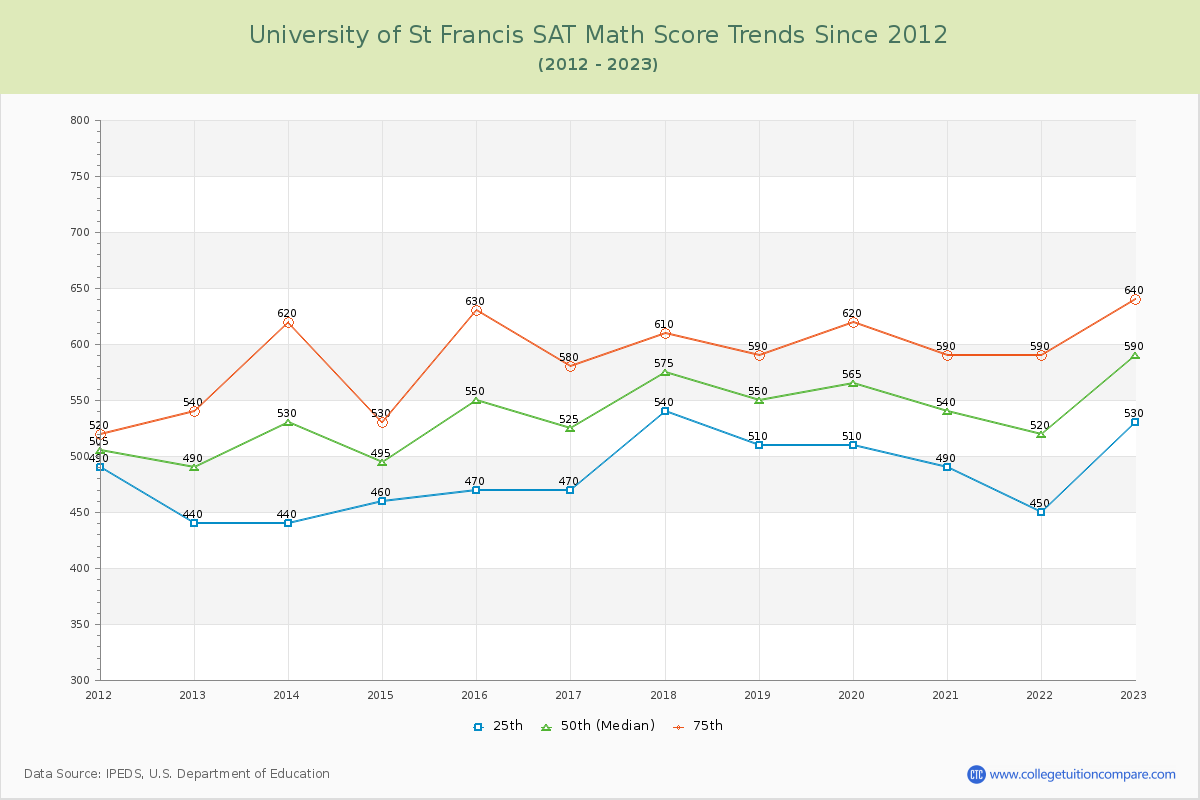
The following table and chart illustrate the changes in SAT scores at University of St Francis since 2012.
| Year | Total | Math | Evidence-Based Reading and Writing | ||||||
|---|---|---|---|---|---|---|---|---|---|
| 25th | 50th | 75th | 25th | 50th | 75th | 25th | 50th | 75th | |
| 2012-13 | 830 | 945 | 1,060 | 440 | 490 | 540 | 390 | 455 | 520 |
| 2013-14 | 920 | 1,075 | 1,230 | 440 | 530 | 620 | 480 | 545 | 610 |
| 2014-15 | 920 | 985 | 1,050 | 460 | 495 | 530 | 460 | 490 | 520 |
| 2015-16 | 940 | 1,050 | 1,160 | 470 | 550 | 630 | 470 | 500 | 530 |
| 2016-17 | 910 | 1,010 | 1,110 | 470 | 525 | 580 | 440 | 485 | 530 |
| 2017-18 | 1,030 | 1,135 | 1,240 | 540 | 575 | 610 | 490 | 560 | 630 |
| 2018-19 | 1,030 | 1,110 | 1,190 | 510 | 550 | 590 | 520 | 560 | 600 |
| 2019-20 | 1,030 | 1,125 | 1,220 | 510 | 565 | 620 | 520 | 560 | 600 |
| 2020-21 | 970 | 1,075 | 1,180 | 490 | 540 | 590 | 480 | 535 | 590 |
| 2021-22 | 920 | 1,045 | 1,170 | 450 | 520 | 590 | 470 | 525 | 580 |
| 2022-23 | 1,030 | 1,110 | 1,240 | 530 | 590 | 640 | 500 | 520 | 600 |
| Average | 957 | 1060 | 1168 | 483 | 539 | 595 | 475 | 521 | 574 |
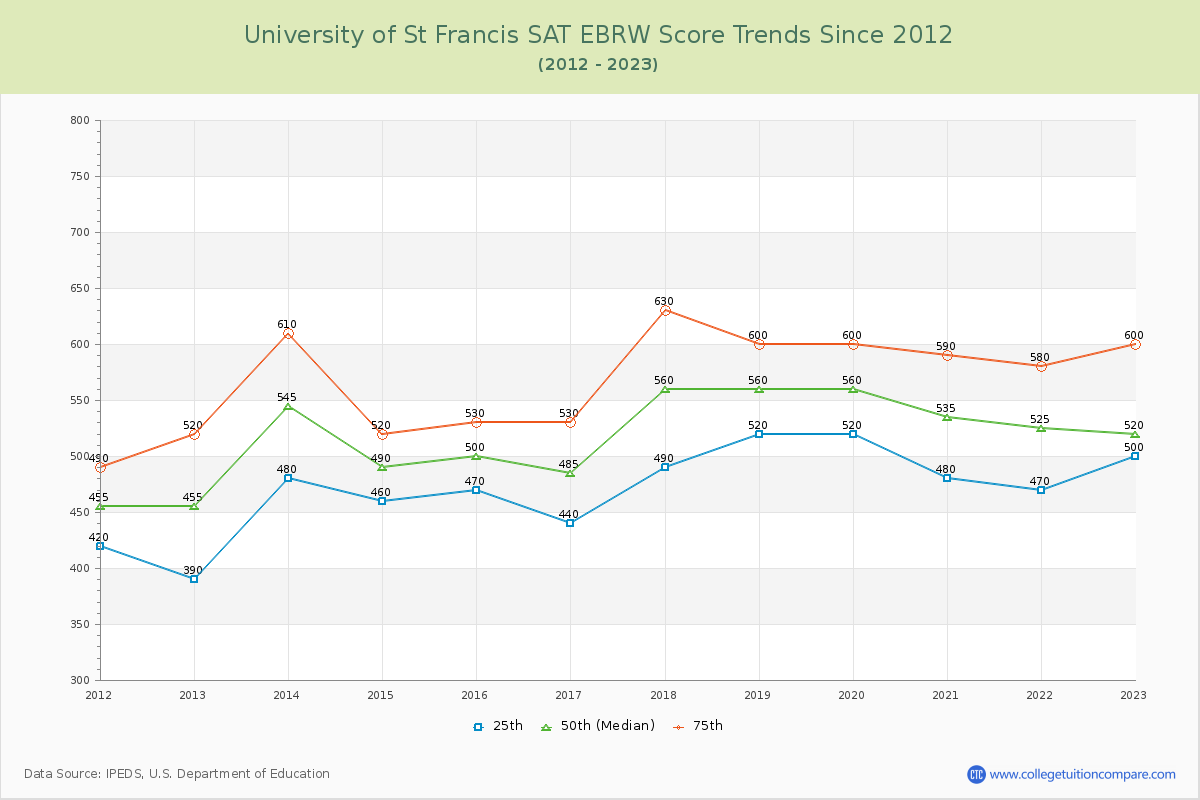
*SAT Evidence-Based Reading and Writing replaces SAT critical reading and writing since year 2017.
**The SAT Writing score is excluded from the total scores for year from 2011 to 2016.