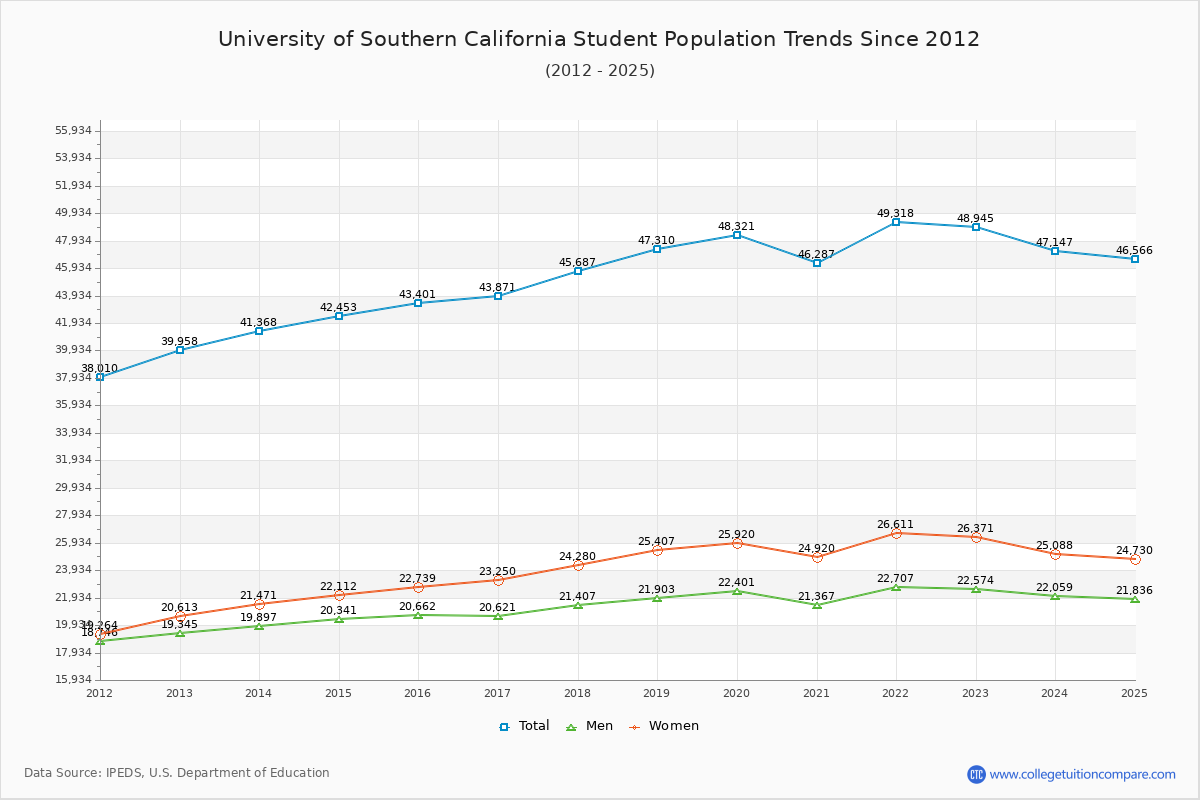
Student Population Changes
The average student population over the last 12 years is 45,174 where 48,945 students are attending the school for the academic year 2022-2023.
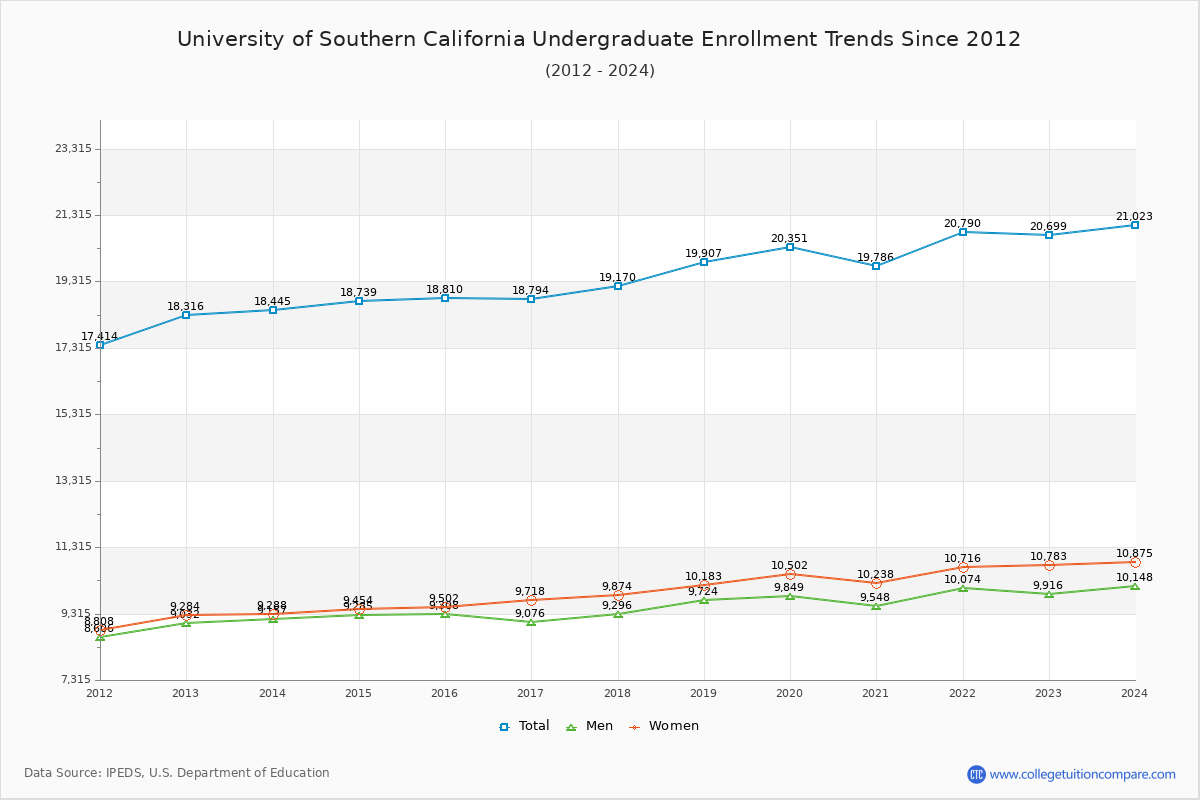
42.29% of total students is undergraduate students and 57.71% students is graduate students. The number of undergraduate students has increased by 2,383 and the graduate enrollment has increased by 6,604 over past 10 years.
The female to male ratio is 1.17 to 1 and it means that there are slightly more female students enrolled in USC than male students.
The following table and chart illustrate the changes in student population by gender at University of Southern California since 2012.
| Year | Total | Undergraduate | Graduate | ||||
|---|---|---|---|---|---|---|---|
| Total | Men | Women | Total | Men | Women | ||
| 2012-13 | 39,958 | 18,316 | 9,032 | 9,284 | 21,642 | 10,313 | 11,329 |
| 2013-14 | 41,368 1,410 | 18,445 129 | 9,157 125 | 9,288 4 | 22,923 1,281 | 10,740 427 | 12,183 854 |
| 2014-15 | 42,453 1,085 | 18,739 294 | 9,285 128 | 9,454 166 | 23,714 791 | 11,056 316 | 12,658 475 |
| 2015-16 | 43,401 948 | 18,810 71 | 9,308 23 | 9,502 48 | 24,591 877 | 11,354 298 | 13,237 579 |
| 2016-17 | 43,871 470 | 18,794 -16 | 9,076 -232 | 9,718 216 | 25,077 486 | 11,545 191 | 13,532 295 |
| 2017-18 | 45,687 1,816 | 19,170 376 | 9,296 220 | 9,874 156 | 26,517 1,440 | 12,111 566 | 14,406 874 |
| 2018-19 | 47,310 1,623 | 19,907 737 | 9,724 428 | 10,183 309 | 27,403 886 | 12,179 68 | 15,224 818 |
| 2019-20 | 48,321 1,011 | 20,351 444 | 9,849 125 | 10,502 319 | 27,970 567 | 12,552 373 | 15,418 194 |
| 2020-21 | 46,287 -2,034 | 19,786 -565 | 9,548 -301 | 10,238 -264 | 26,501 -1,469 | 11,819 -733 | 14,682 -736 |
| 2021-22 | 49,318 3,031 | 20,790 1,004 | 10,074 526 | 10,716 478 | 28,528 2,027 | 12,633 814 | 15,895 1,213 |
| 2022-23 | 48,945 -373 | 20,699 -91 | 9,916 -158 | 10,783 67 | 28,246 -282 | 12,658 25 | 15,588 -307 |
| Average | 45,174 | 19,437 | 9,479 | 9,958 | 25,737 | 11,724 | 14,014 |