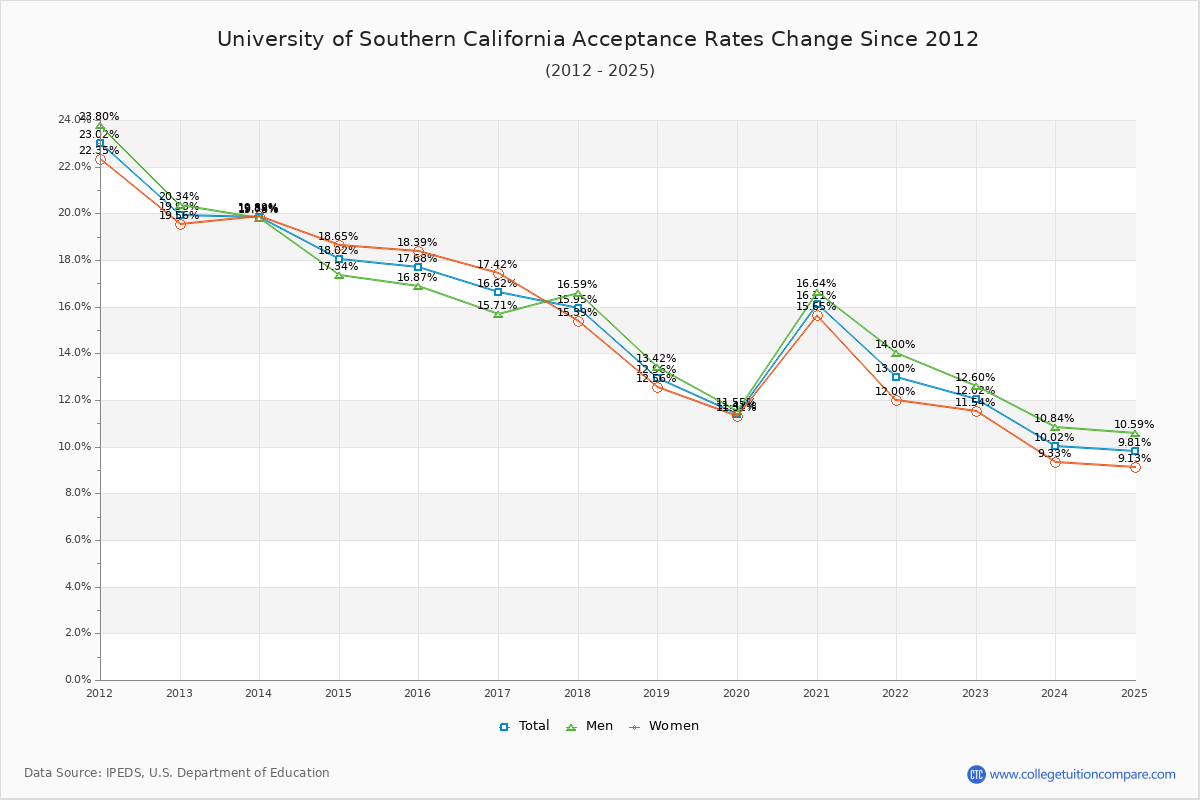
Acceptance Rate Changes
The average acceptance rate over the last 10 years is 15.78%, and this year's acceptance rate is 12.02% at University of Southern California. By gender, men students' acceptance rate is 15.89% and women students' rate is 15.67%. University of Southern California has beep kept its acceptance rate very low and it is hard that applicants admit into the school.
The next table and chart illustrate the acceptance rates changes at University of Southern California over the past 11 years (2012-2023).
| Year | Total | Men | Women |
|---|---|---|---|
| 2012-13 | 19.93% | 20.34% | 19.56% |
| 2013-14 | 19.84% -0.09% |
19.78% 0.33% |
19.89% 0.33% |
| 2014-15 | 18.02% -1.81% |
17.34% -1.24% |
18.65% -1.24% |
| 2015-16 | 17.68% -0.34% |
16.87% -0.25% |
18.39% -0.25% |
| 2016-17 | 16.62% -1.06% |
15.71% -0.97% |
17.42% -0.97% |
| 2017-18 | 15.95% -0.67% |
16.59% -2.03% |
15.39% -2.03% |
| 2018-19 | 12.96% -3.00% |
13.42% -2.83% |
12.56% -2.83% |
| 2019-20 | 11.42% -1.54% |
11.55% -1.25% |
11.31% -1.25% |
| 2020-21 | 16.11% 4.69% |
16.64% 4.34% |
15.65% 4.34% |
| 2021-22 | 13.00% -3.11% |
14.00% -3.64% |
12.00% -3.64% |
| 2022-23 | 12.02% -0.98% |
12.60% -0.46% |
11.54% -0.46% |
| Average | 15.78% | 15.89% | 15.67% |