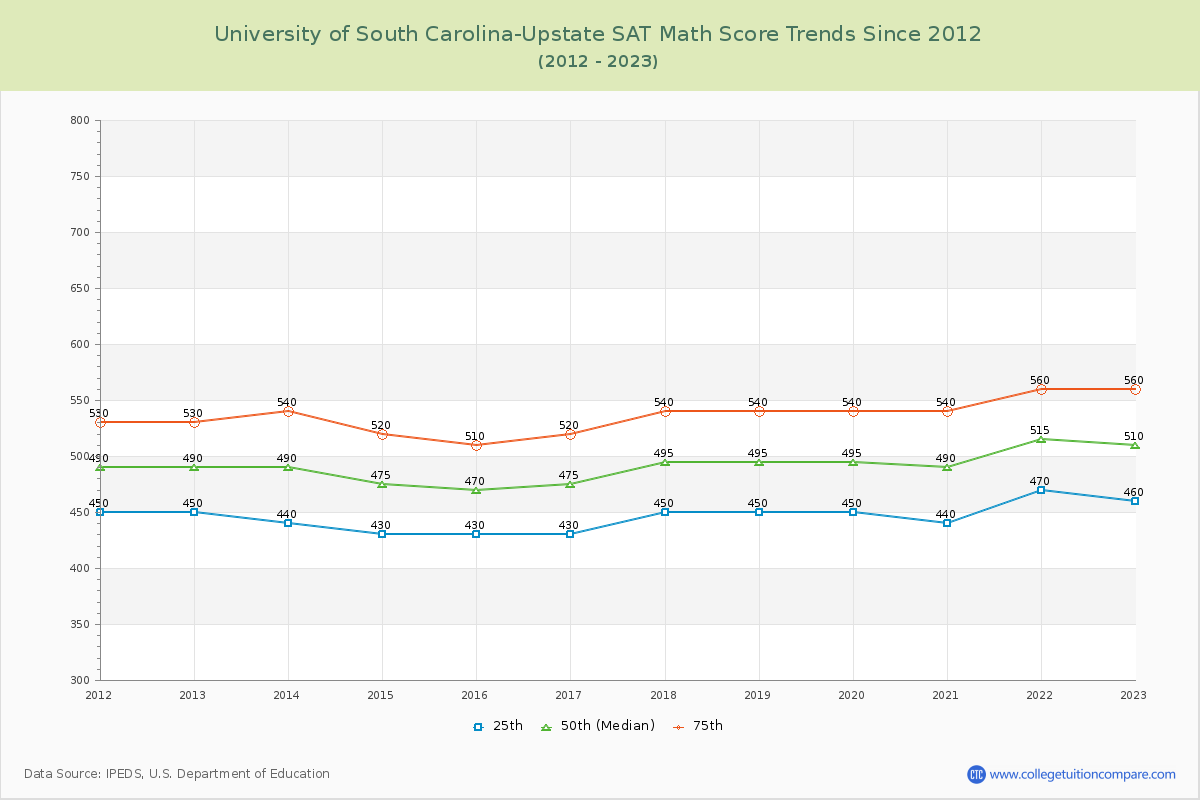
SAT Scores Over Time
The 2023 SAT score is 1050 at U of South Carolina-Upstate. Over the past 12 years, the average SAT score is 899 (25th percentile) and 1087 (75th percentile). Compared to similar schools, the submitted SAT scores are around national average at U of South Carolina-Upstate.
The following table and chart illustrate the changes in SAT scores at University of South Carolina-Upstate since 2012.
| Year | Total | Math | Evidence-Based Reading and Writing | ||||||
|---|---|---|---|---|---|---|---|---|---|
| 25th | 50th | 75th | 25th | 50th | 75th | 25th | 50th | 75th | |
| 2012-13 | 880 | 970 | 1,060 | 450 | 490 | 530 | 430 | 480 | 530 |
| 2013-14 | 880 | 975 | 1,070 | 440 | 490 | 540 | 440 | 485 | 530 |
| 2014-15 | 850 | 945 | 1,040 | 430 | 475 | 520 | 420 | 470 | 520 |
| 2015-16 | 860 | 950 | 1,040 | 430 | 470 | 510 | 430 | 480 | 530 |
| 2016-17 | 860 | 950 | 1,040 | 430 | 475 | 520 | 430 | 475 | 520 |
| 2017-18 | 920 | 1,010 | 1,100 | 450 | 495 | 540 | 470 | 515 | 560 |
| 2018-19 | 920 | 1,015 | 1,110 | 450 | 495 | 540 | 470 | 520 | 570 |
| 2019-20 | 920 | 1,015 | 1,110 | 450 | 495 | 540 | 470 | 520 | 570 |
| 2020-21 | 900 | 995 | 1,090 | 440 | 490 | 540 | 460 | 505 | 550 |
| 2021-22 | 950 | 1,050 | 1,150 | 470 | 515 | 560 | 480 | 535 | 590 |
| 2022-23 | 950 | 1,050 | 1,150 | 460 | 510 | 560 | 490 | 540 | 590 |
| Average | 899 | 993 | 1087 | 445 | 491 | 536 | 454 | 502 | 551 |
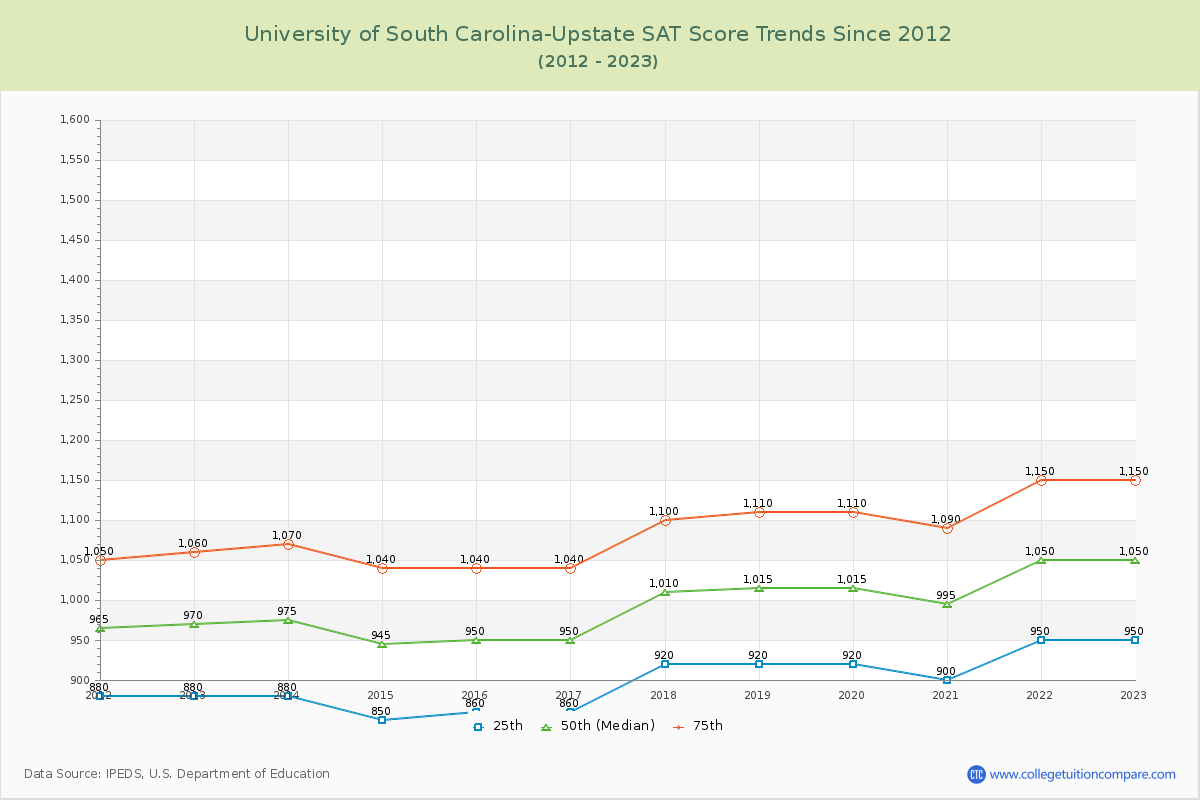
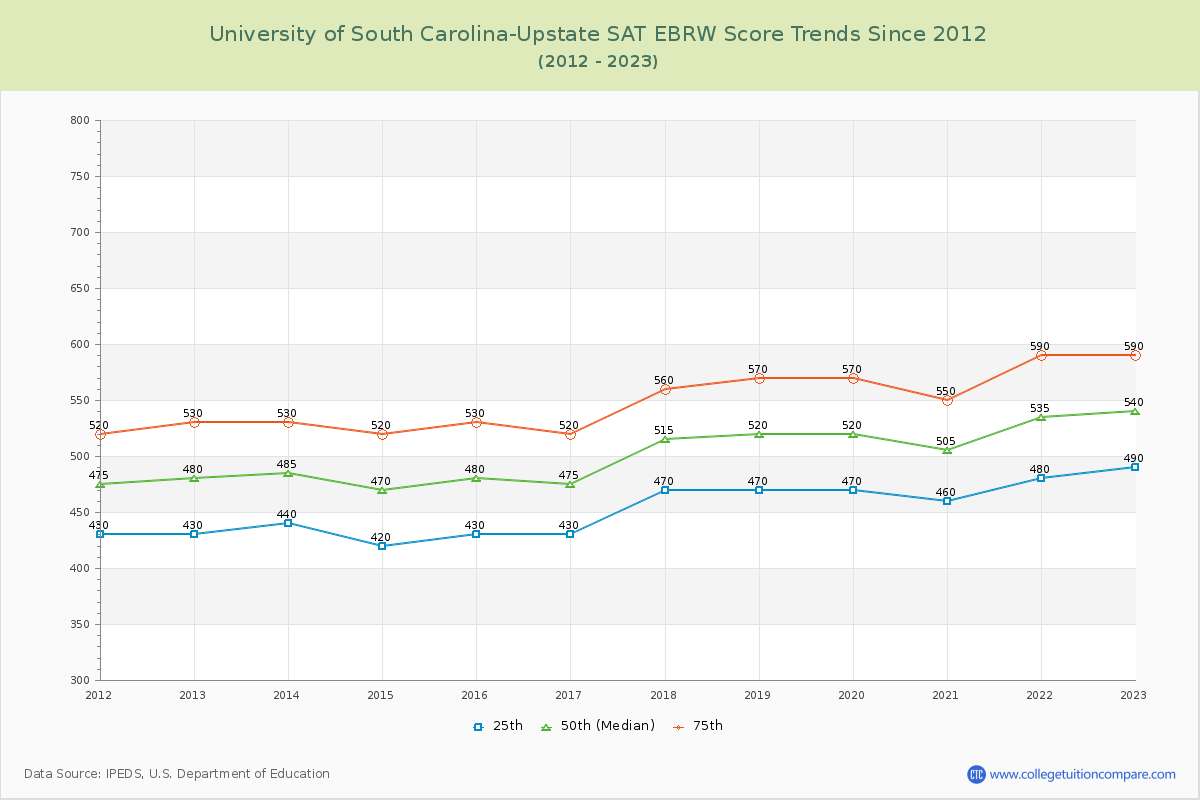
*SAT Evidence-Based Reading and Writing replaces SAT critical reading and writing since year 2017.
**The SAT Writing score is excluded from the total scores for year from 2011 to 2016.