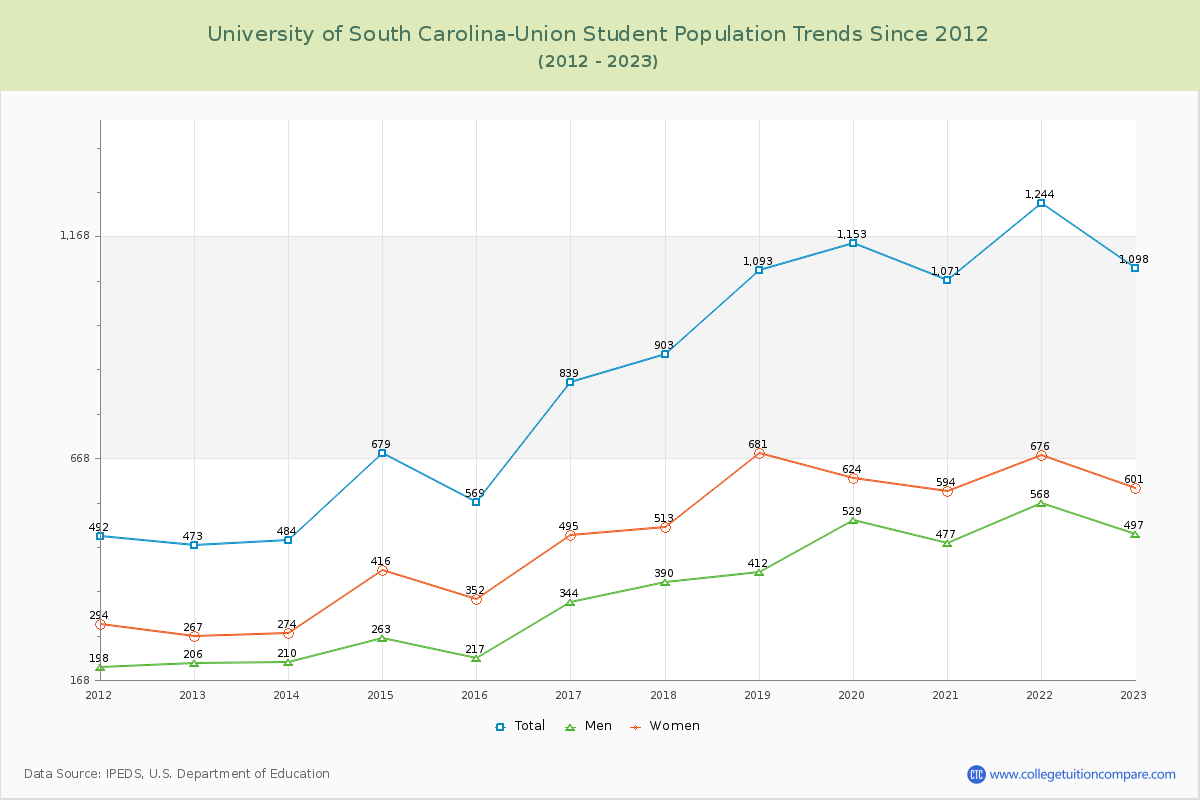
Student Population Changes
The average student population over the last 12 years is 873 where 1,098 students are attending the school for the academic year 2022-2023.
The female to male ratio is 1.21 to 1 and it means that there are slightly more female students enrolled in U of South Carolina-Union than male students.
The following table and chart illustrate the changes in student population by gender at University of South Carolina-Union since 2012.
| Year | Total | Men | Women |
|---|---|---|---|
| 2012-13 | 473 | 206 | 267 |
| 2013-14 | 484 11 | 210 4 | 274 7 |
| 2014-15 | 679 195 | 263 53 | 416 142 |
| 2015-16 | 569 -110 | 217 -46 | 352 -64 |
| 2016-17 | 839 270 | 344 127 | 495 143 |
| 2017-18 | 903 64 | 390 46 | 513 18 |
| 2018-19 | 1,093 190 | 412 22 | 681 168 |
| 2019-20 | 1,153 60 | 529 117 | 624 -57 |
| 2020-21 | 1,071 -82 | 477 -52 | 594 -30 |
| 2021-22 | 1,244 173 | 568 91 | 676 82 |
| 2022-23 | 1,098 -146 | 497 -71 | 601 -75 |
| Average | 873 | 374 | 499 |