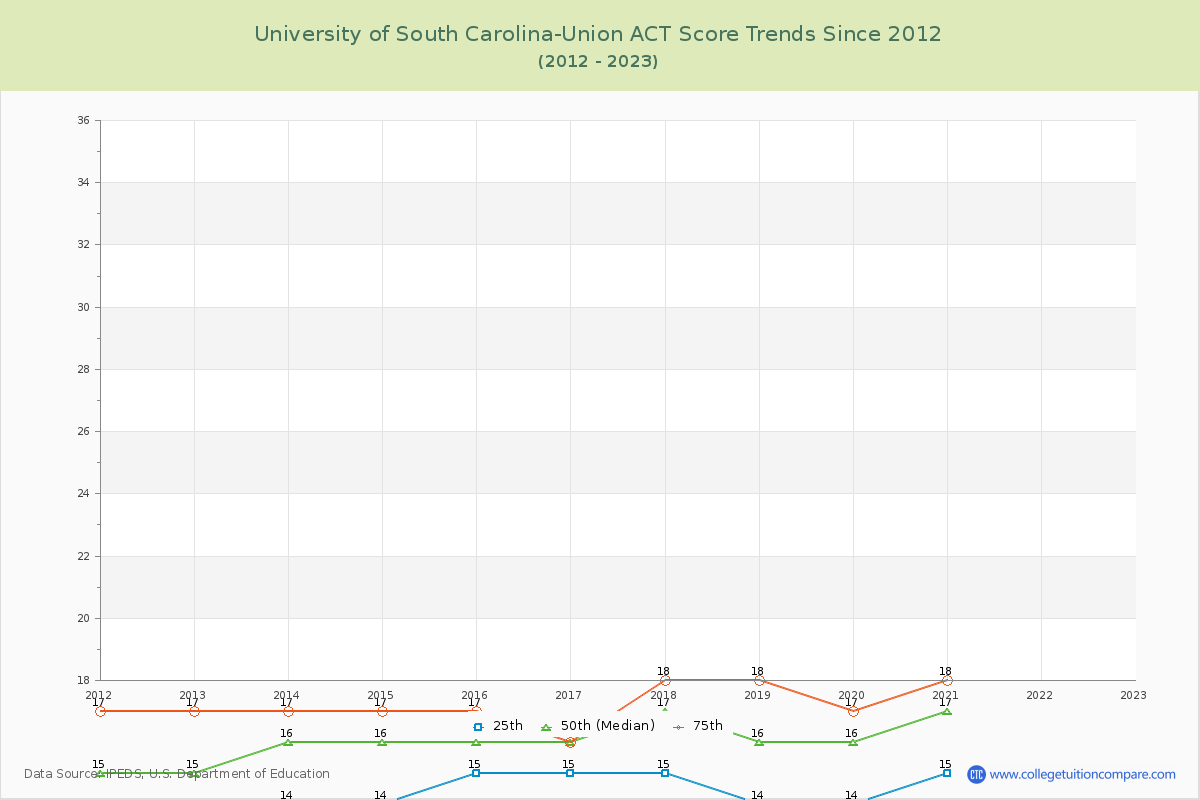
SAT Scores Over Time
The 2023 SAT score is at U of South Carolina-Union. Over the past 12 years, the average SAT score is 757 (25th percentile) and 944 (75th percentile). Compared to similar schools, the submitted SAT scores are around national average at U of South Carolina-Union.
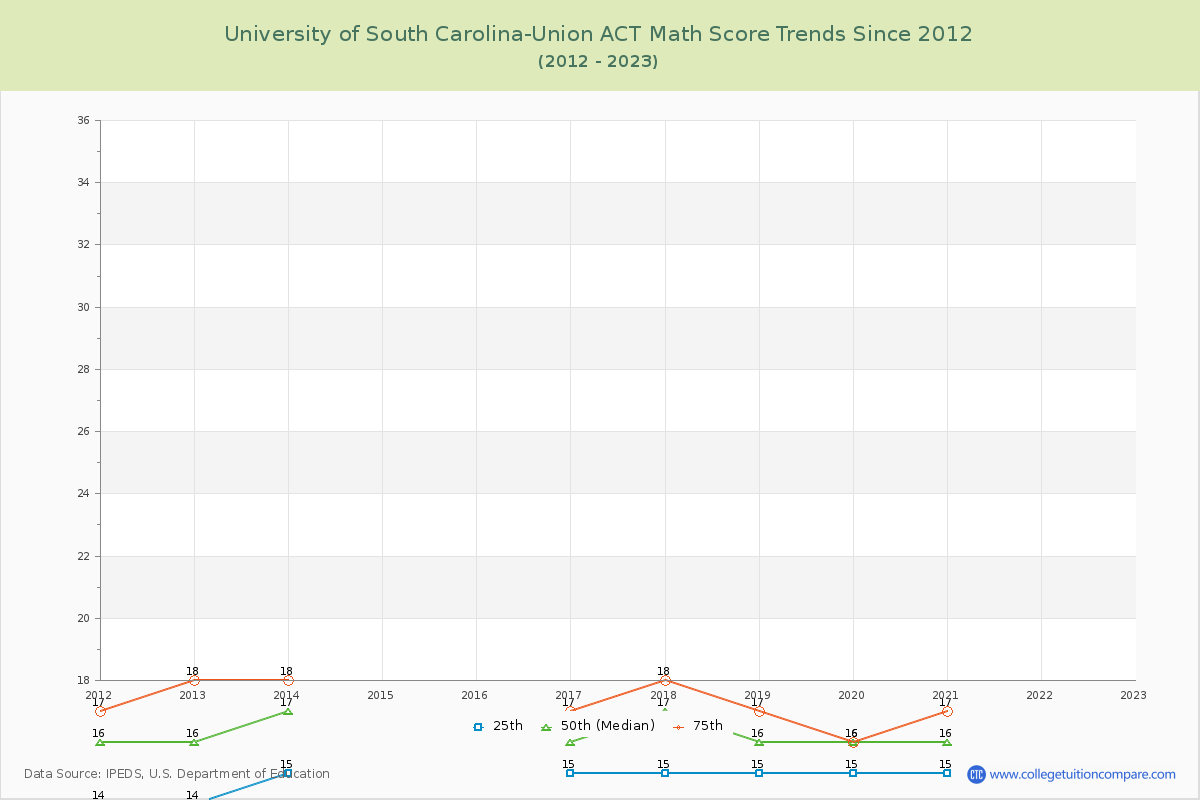
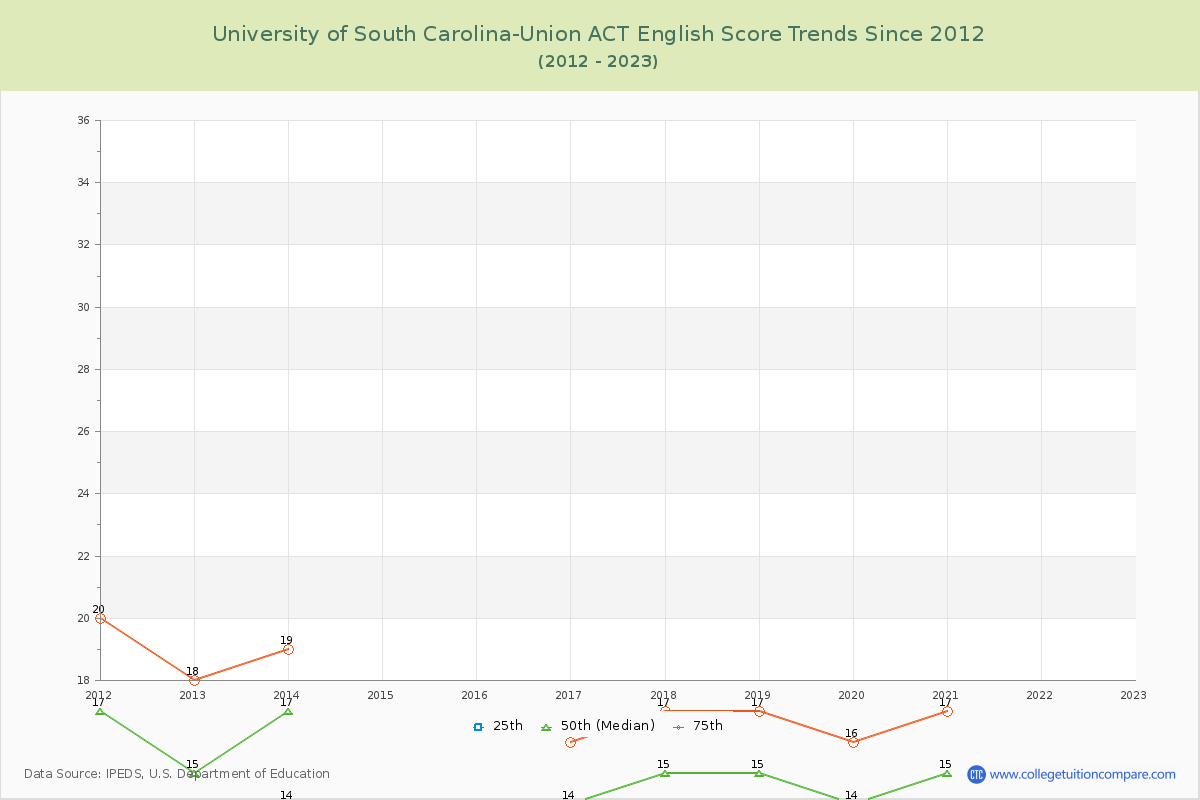
The following table and chart illustrate the changes in SAT scores at University of South Carolina-Union since 2012.
| Year | Total | Math | Evidence-Based Reading and Writing | ||||||
|---|---|---|---|---|---|---|---|---|---|
| 25th | 50th | 75th | 25th | 50th | 75th | 25th | 50th | 75th | |
| 2012-13 | 770 | 883 | 995 | 405 | 458 | 510 | 365 | 425 | 485 |
| 2013-14 | 770 | 885 | 1,000 | 390 | 455 | 520 | 380 | 430 | 480 |
| 2014-15 | 700 | 785 | 870 | 350 | 395 | 440 | 350 | 390 | 430 |
| 2015-16 | 690 | 755 | 820 | 340 | 375 | 410 | 350 | 380 | 410 |
| 2016-17 | 700 | 755 | 810 | 340 | 375 | 410 | 360 | 380 | 400 |
| 2017-18 | 790 | 880 | 970 | 380 | 430 | 480 | 410 | 450 | 490 |
| 2018-19 | 800 | 920 | 1,040 | 390 | 445 | 500 | 410 | 475 | 540 |
| 2019-20 | 765 | 868 | 970 | 365 | 428 | 490 | 400 | 440 | 480 |
| 2020-21 | 830 | 925 | 1,020 | 410 | 455 | 500 | 420 | 470 | 520 |
| 2021-22 | - | - | - | - | - | - | - | - | - |
| 2022-23 | - | - | - | - | - | - | - | - | - |
| Average | 757 | 851 | 944 | 374 | 424 | 473 | 383 | 427 | 471 |
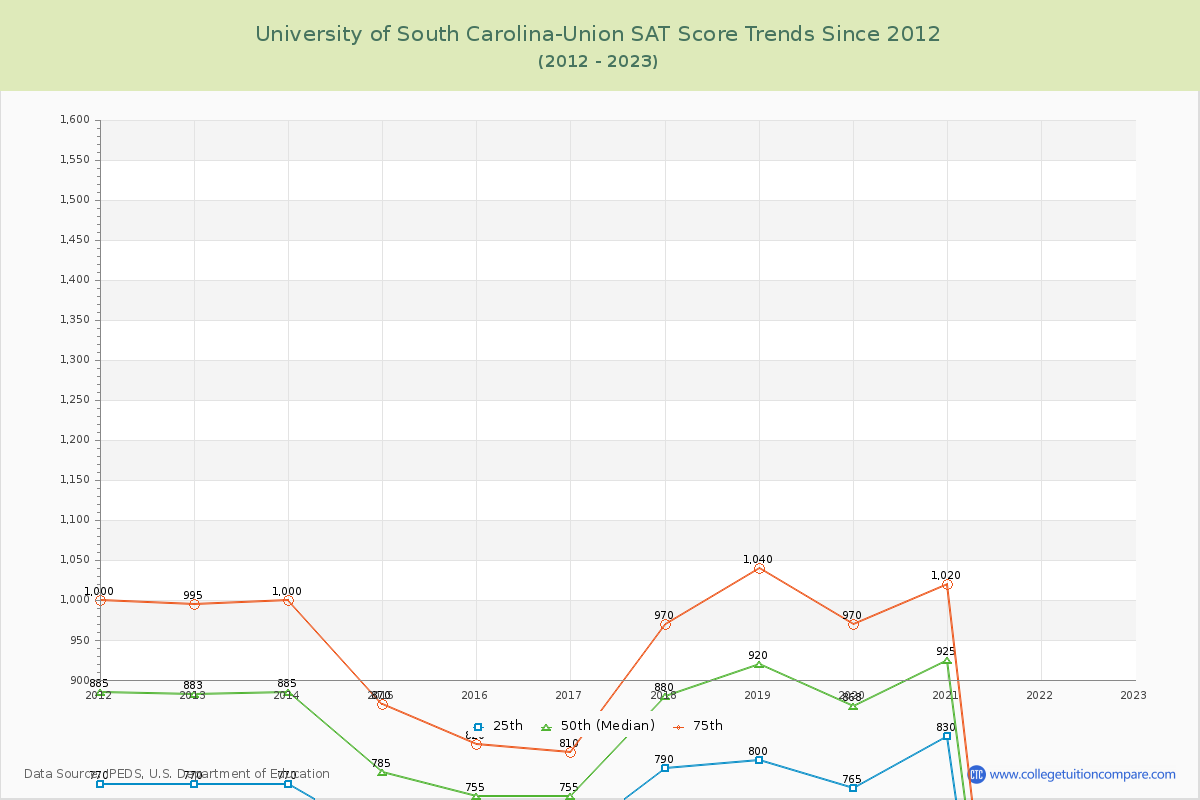
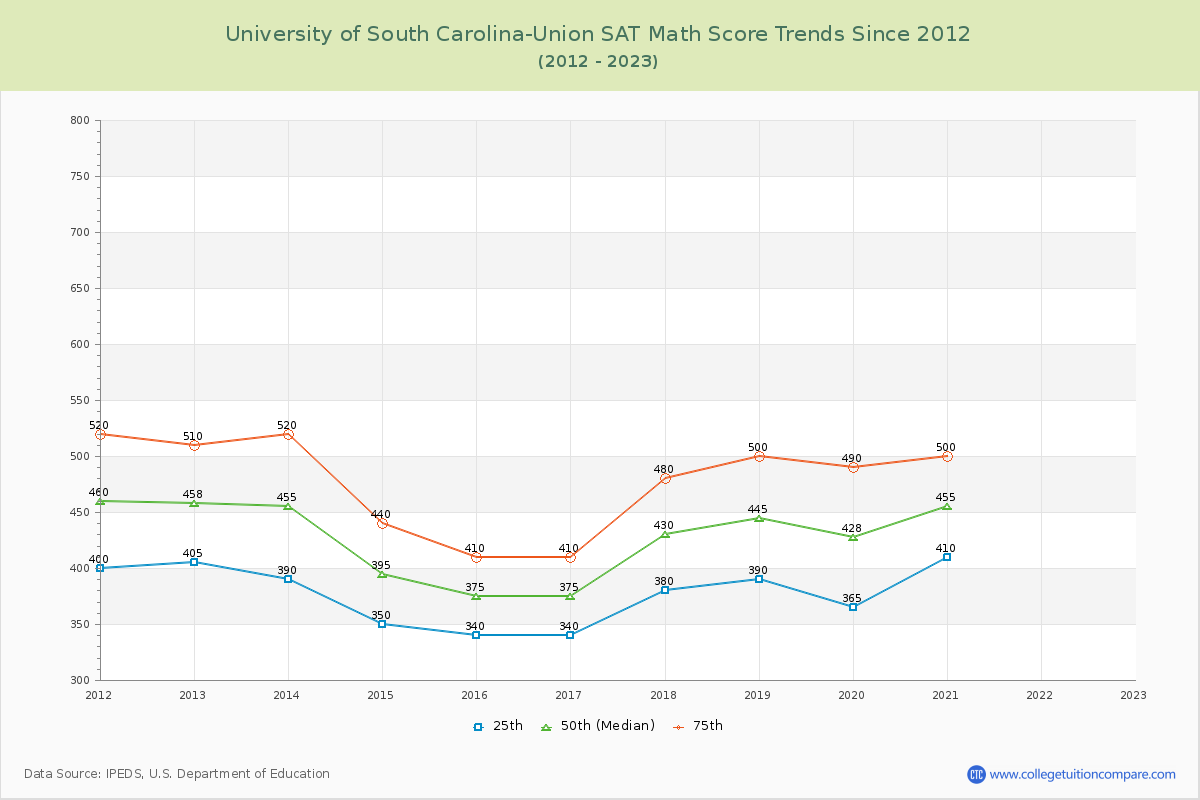
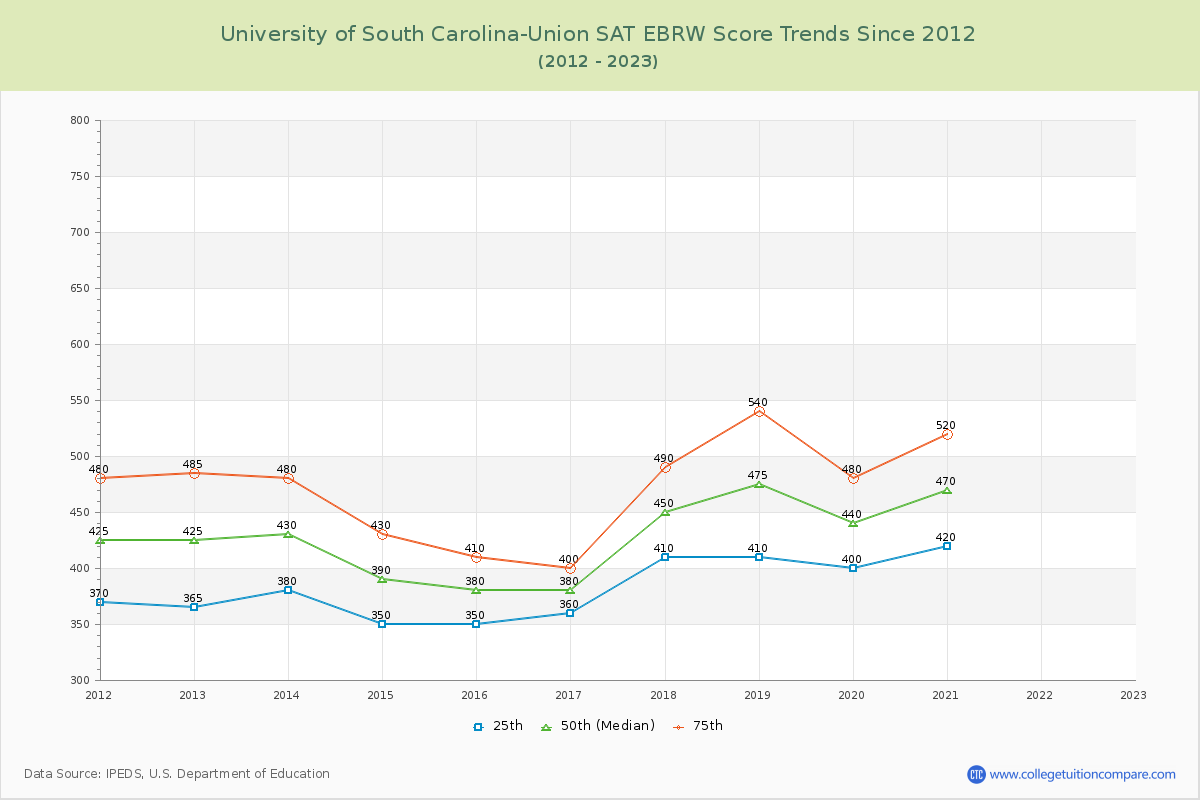
*SAT Evidence-Based Reading and Writing replaces SAT critical reading and writing since year 2017.
**The SAT Writing score is excluded from the total scores for year from 2011 to 2016.