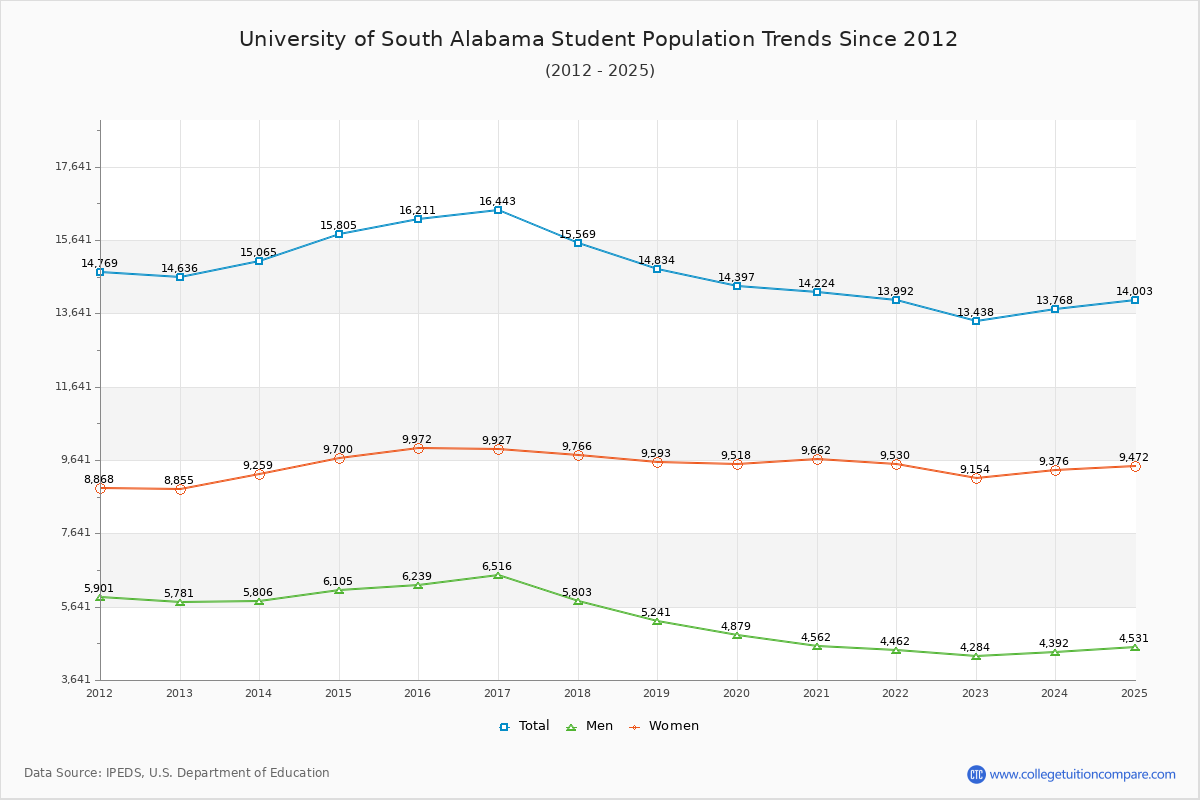
Student Population Changes
The average student population over the last 12 years is 14,965 where 13,438 students are attending the school for the academic year 2022-2023.
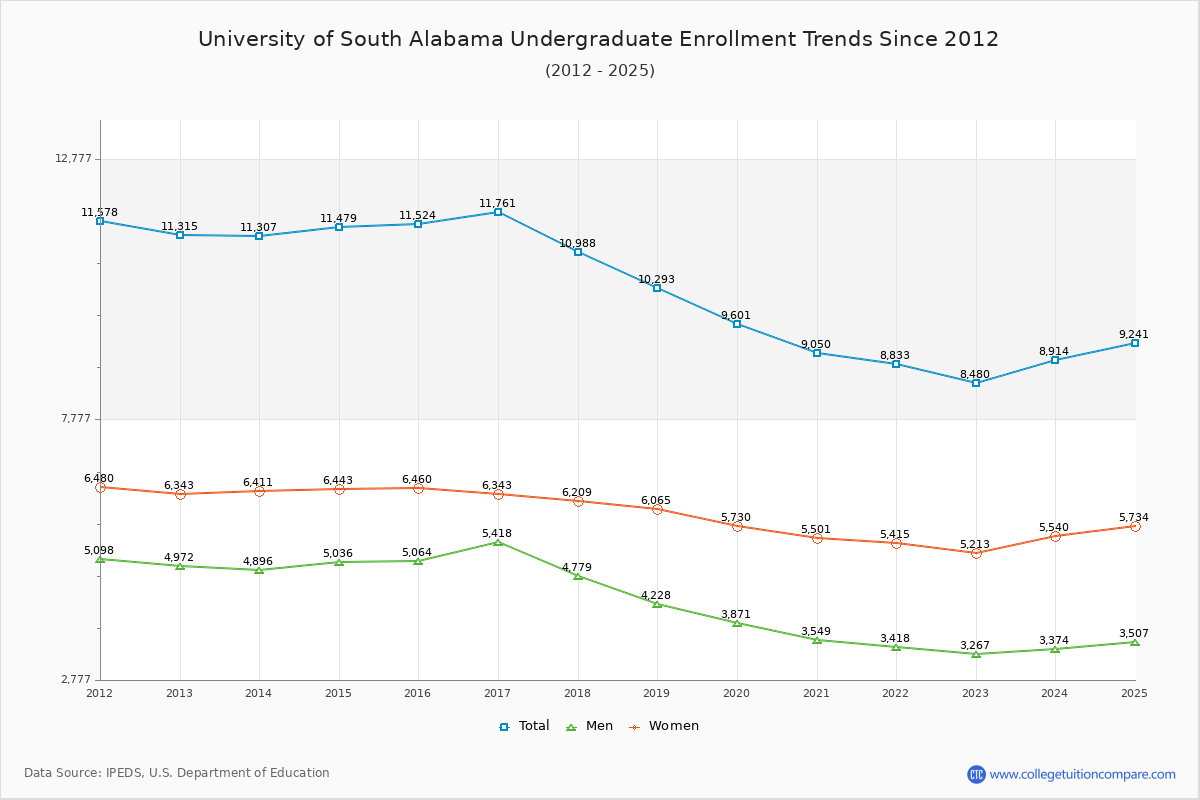
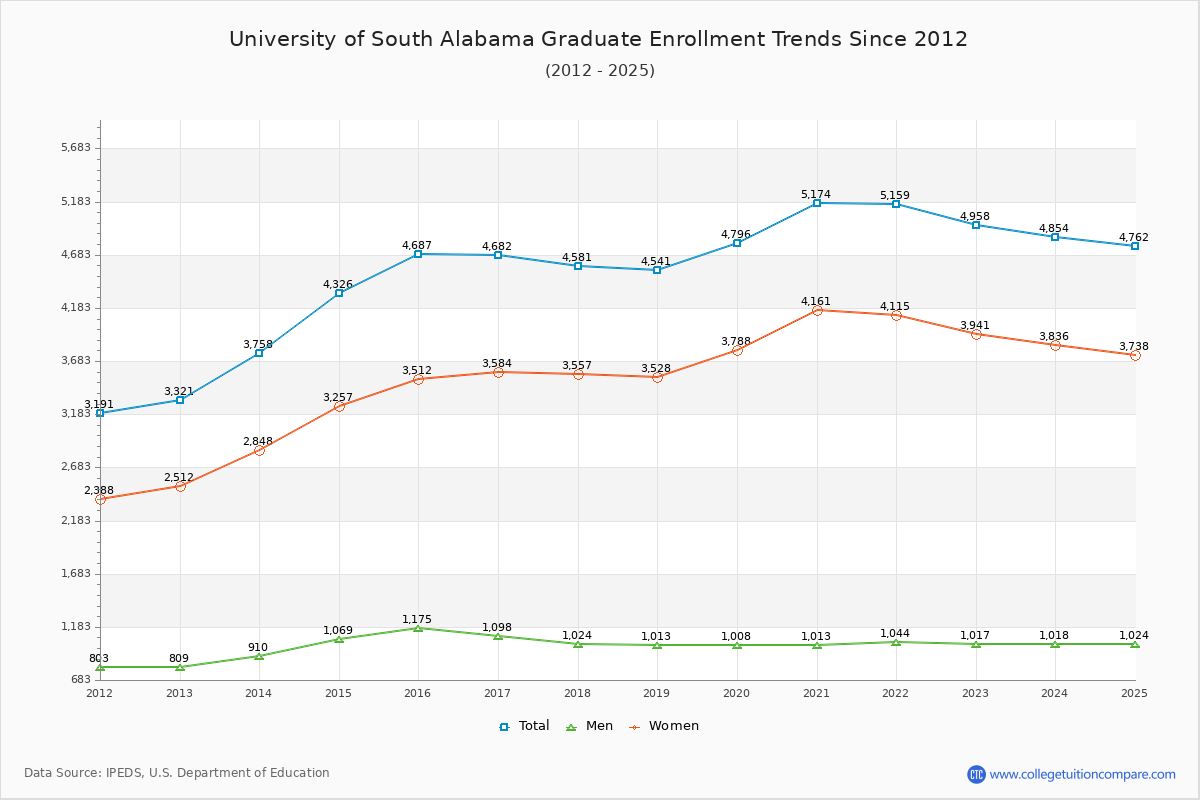
63.10% of total students is undergraduate students and 36.90% students is graduate students. The number of undergraduate students has decreased by 2,835 and the graduate enrollment has increased by 1,637 over past 10 years.
The female to male ratio is 2.14 to 1 and it means that there are far more female students enrolled in U of South Alabama than male students.
The following table and chart illustrate the changes in student population by gender at University of South Alabama since 2012.
| Year | Total | Undergraduate | Graduate | ||||
|---|---|---|---|---|---|---|---|
| Total | Men | Women | Total | Men | Women | ||
| 2012-13 | 14,636 | 11,315 | 4,972 | 6,343 | 3,321 | 809 | 2,512 |
| 2013-14 | 15,065 429 | 11,307 -8 | 4,896 -76 | 6,411 68 | 3,758 437 | 910 101 | 2,848 336 |
| 2014-15 | 15,805 740 | 11,479 172 | 5,036 140 | 6,443 32 | 4,326 568 | 1,069 159 | 3,257 409 |
| 2015-16 | 16,211 406 | 11,524 45 | 5,064 28 | 6,460 17 | 4,687 361 | 1,175 106 | 3,512 255 |
| 2016-17 | 16,443 232 | 11,761 237 | 5,418 354 | 6,343 -117 | 4,682 -5 | 1,098 -77 | 3,584 72 |
| 2017-18 | 15,569 -874 | 10,988 -773 | 4,779 -639 | 6,209 -134 | 4,581 -101 | 1,024 -74 | 3,557 -27 |
| 2018-19 | 14,834 -735 | 10,293 -695 | 4,228 -551 | 6,065 -144 | 4,541 -40 | 1,013 -11 | 3,528 -29 |
| 2019-20 | 14,397 -437 | 9,601 -692 | 3,871 -357 | 5,730 -335 | 4,796 255 | 1,008 -5 | 3,788 260 |
| 2020-21 | 14,224 -173 | 9,050 -551 | 3,549 -322 | 5,501 -229 | 5,174 378 | 1,013 5 | 4,161 373 |
| 2021-22 | 13,992 -232 | 8,833 -217 | 3,418 -131 | 5,415 -86 | 5,159 -15 | 1,044 31 | 4,115 -46 |
| 2022-23 | 13,438 -554 | 8,480 -353 | 3,267 -151 | 5,213 -202 | 4,958 -201 | 1,017 -27 | 3,941 -174 |
| Average | 14,965 | 10,421 | 4,409 | 6,012 | 4,544 | 1,016 | 3,528 |