Student Population Changes
The average student population over the last 12 years is 2,237 where 1,903 students are attending the school for the academic year 2022-2023.
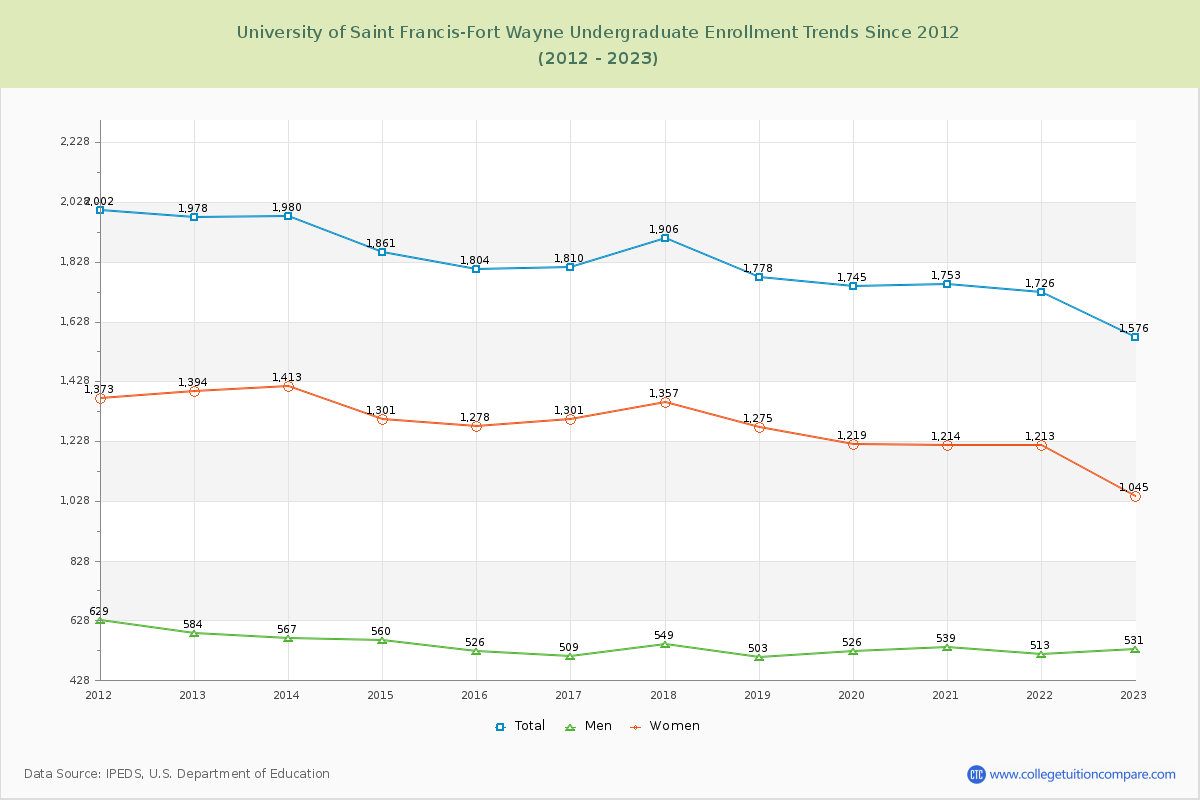
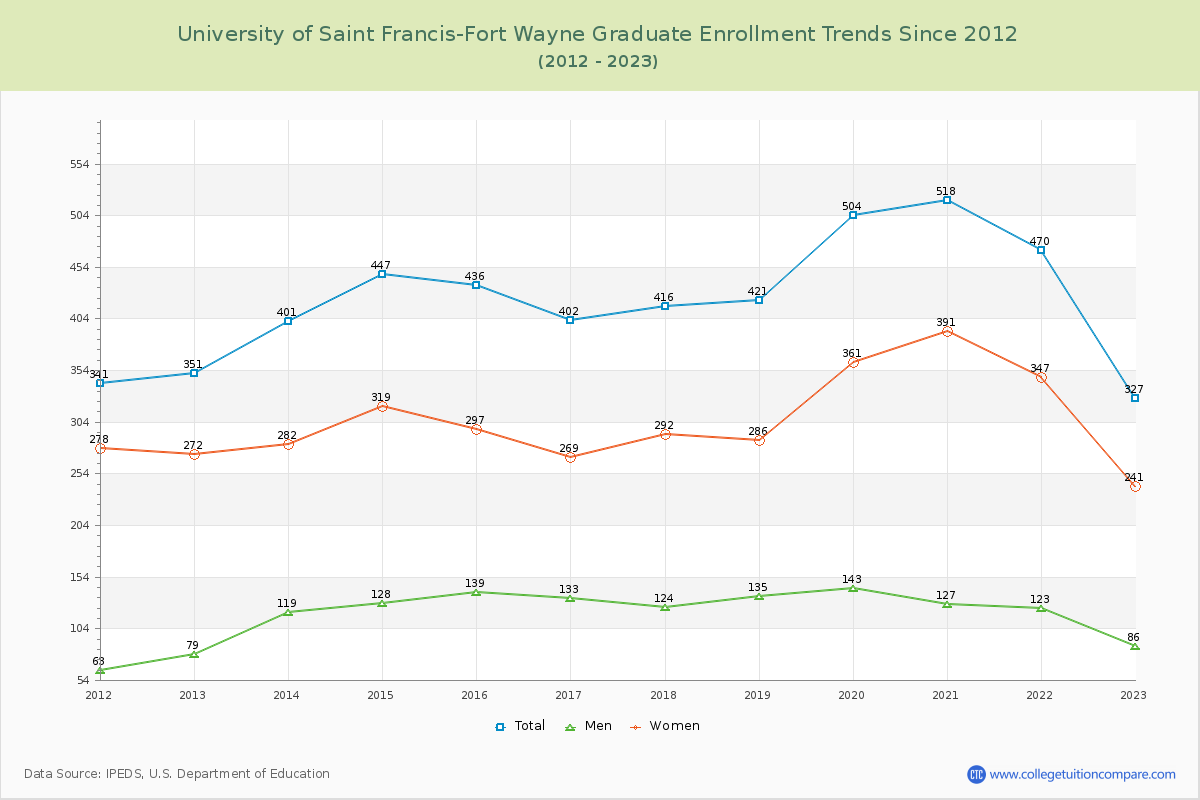
82.82% of total students is undergraduate students and 17.18% students is graduate students. The number of undergraduate students has decreased by 402 and the graduate enrollment has decreased by 24 over past 10 years.
The female to male ratio is 2.08 to 1 and it means that there are far more female students enrolled in USF than male students.
The following table and chart illustrate the changes in student population by gender at University of Saint Francis-Fort Wayne since 2012.
| Year | Total | Undergraduate | Graduate | ||||
|---|---|---|---|---|---|---|---|
| Total | Men | Women | Total | Men | Women | ||
| 2012-13 | 2,329 | 1,978 | 584 | 1,394 | 351 | 79 | 272 |
| 2013-14 | 2,381 52 | 1,980 2 | 567 -17 | 1,413 19 | 401 50 | 119 40 | 282 10 |
| 2014-15 | 2,308 -73 | 1,861 -119 | 560 -7 | 1,301 -112 | 447 46 | 128 9 | 319 37 |
| 2015-16 | 2,240 -68 | 1,804 -57 | 526 -34 | 1,278 -23 | 436 -11 | 139 11 | 297 -22 |
| 2016-17 | 2,212 -28 | 1,810 6 | 509 -17 | 1,301 23 | 402 -34 | 133 -6 | 269 -28 |
| 2017-18 | 2,322 110 | 1,906 96 | 549 40 | 1,357 56 | 416 14 | 124 -9 | 292 23 |
| 2018-19 | 2,199 -123 | 1,778 -128 | 503 -46 | 1,275 -82 | 421 5 | 135 11 | 286 -6 |
| 2019-20 | 2,249 50 | 1,745 -33 | 526 23 | 1,219 -56 | 504 83 | 143 8 | 361 75 |
| 2020-21 | 2,271 22 | 1,753 8 | 539 13 | 1,214 -5 | 518 14 | 127 -16 | 391 30 |
| 2021-22 | 2,196 -75 | 1,726 -27 | 513 -26 | 1,213 -1 | 470 -48 | 123 -4 | 347 -44 |
| 2022-23 | 1,903 -293 | 1,576 -150 | 531 18 | 1,045 -168 | 327 -143 | 86 -37 | 241 -106 |
| Average | 2,237 | 1,811 | 537 | 1,274 | 427 | 121 | 305 |