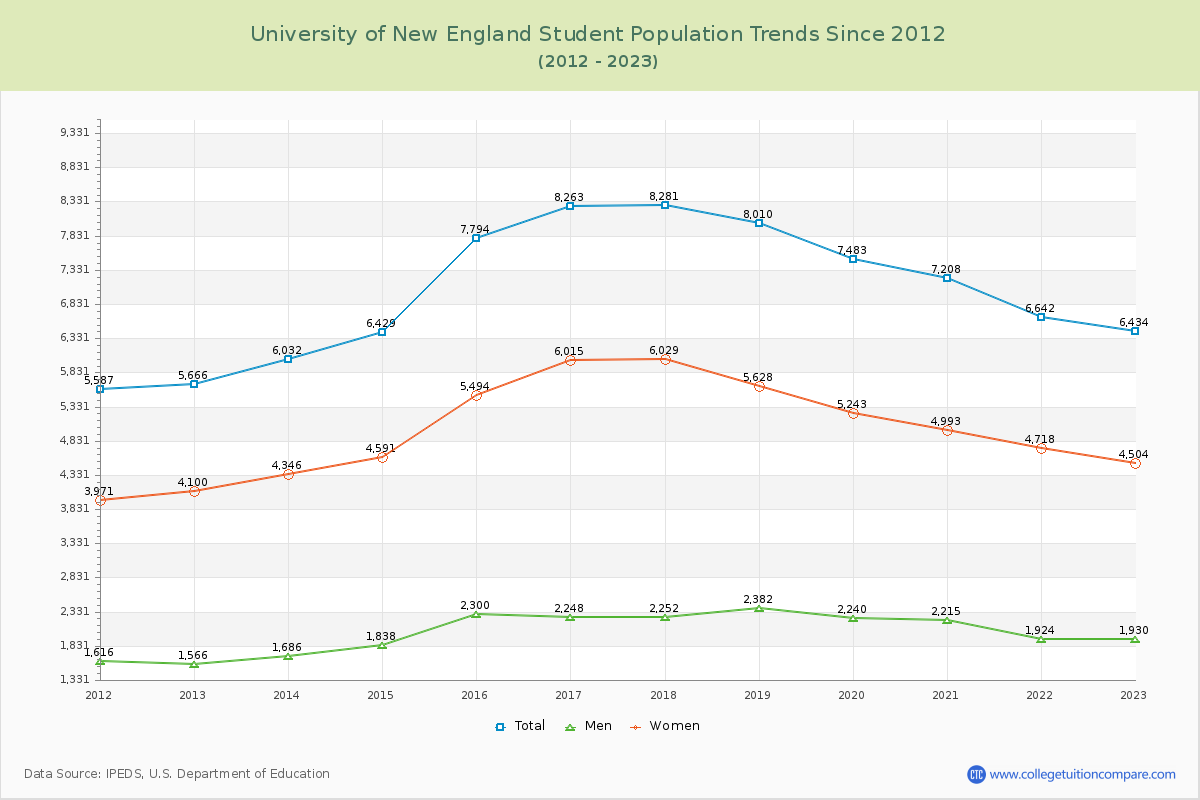
Student Population Changes
The average student population over the last 12 years is 7,113 where 6,434 students are attending the school for the academic year 2022-2023.
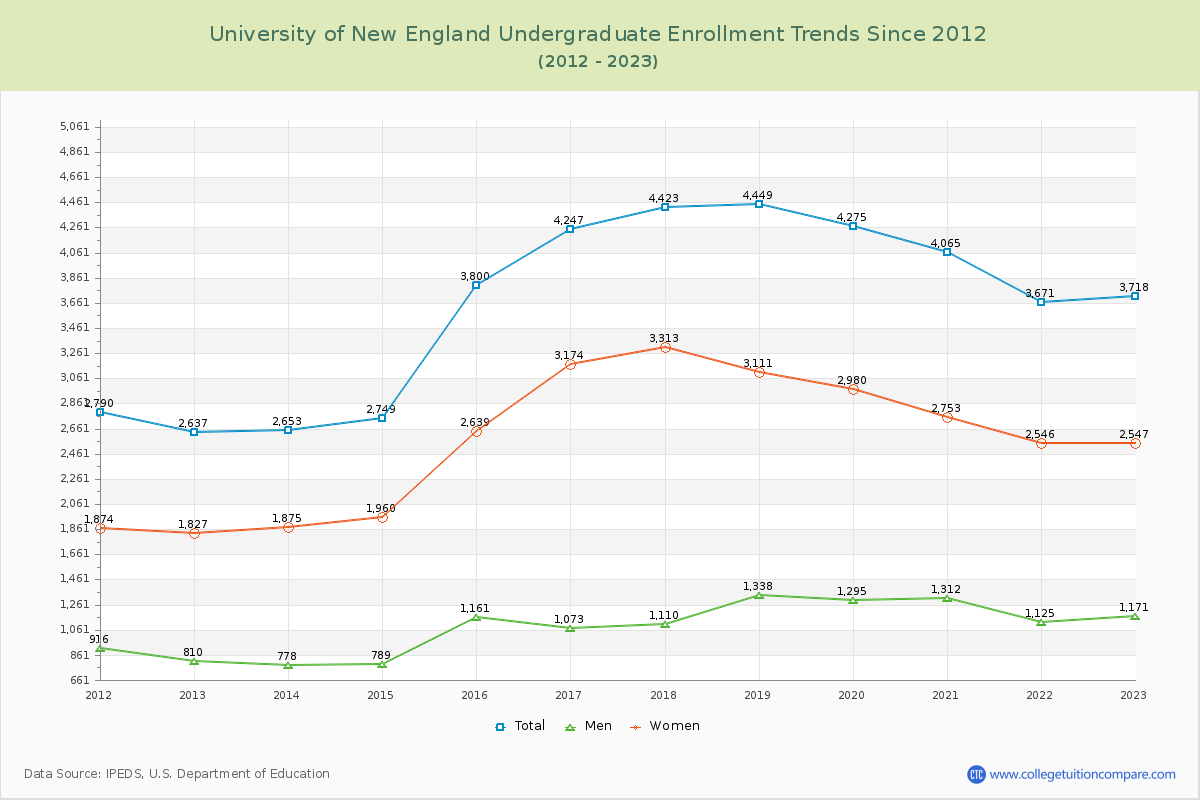
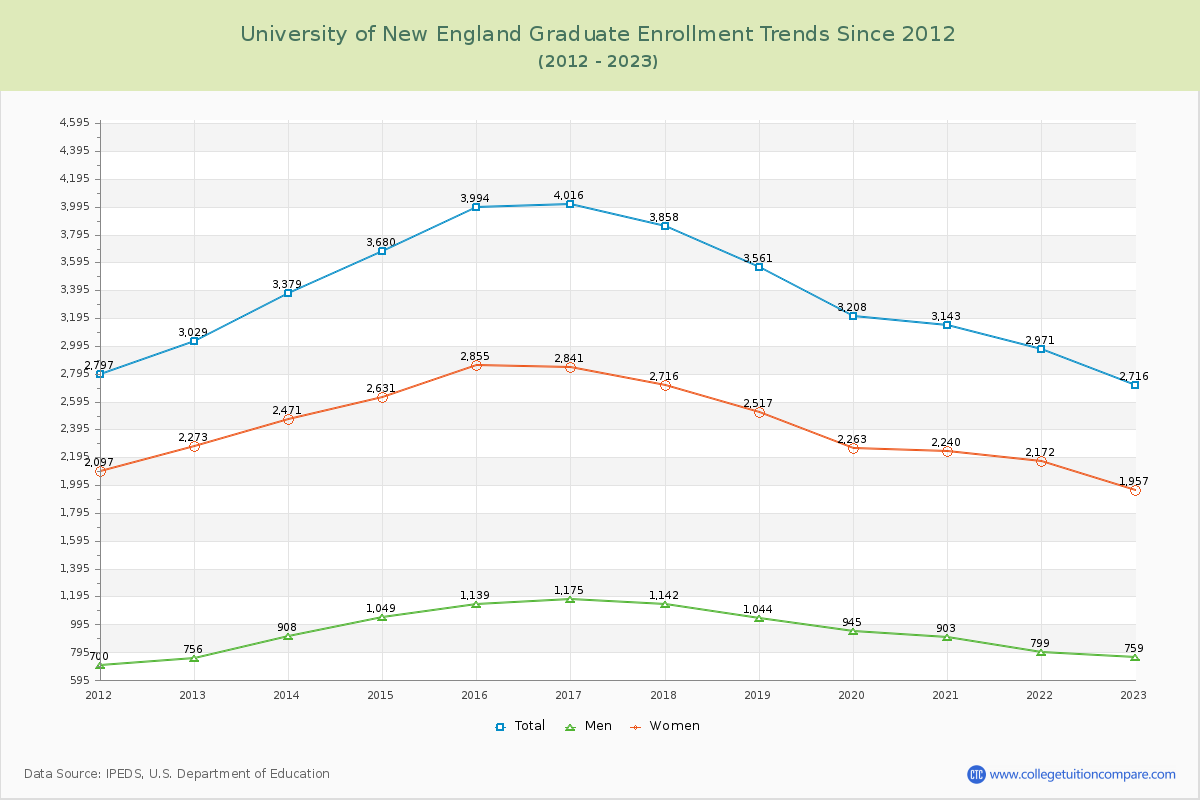
57.79% of total students is undergraduate students and 42.21% students is graduate students. The number of undergraduate students has increased by 1,081 and the graduate enrollment has decreased by 313 over past 10 years.
The female to male ratio is 2.33 to 1 and it means that there are far more female students enrolled in U of New England than male students.
The following table and chart illustrate the changes in student population by gender at University of New England since 2012.
| Year | Total | Undergraduate | Graduate | ||||
|---|---|---|---|---|---|---|---|
| Total | Men | Women | Total | Men | Women | ||
| 2012-13 | 5,666 | 2,637 | 810 | 1,827 | 3,029 | 756 | 2,273 |
| 2013-14 | 6,032 366 | 2,653 16 | 778 -32 | 1,875 48 | 3,379 350 | 908 152 | 2,471 198 |
| 2014-15 | 6,429 397 | 2,749 96 | 789 11 | 1,960 85 | 3,680 301 | 1,049 141 | 2,631 160 |
| 2015-16 | 7,794 1,365 | 3,800 1,051 | 1,161 372 | 2,639 679 | 3,994 314 | 1,139 90 | 2,855 224 |
| 2016-17 | 8,263 469 | 4,247 447 | 1,073 -88 | 3,174 535 | 4,016 22 | 1,175 36 | 2,841 -14 |
| 2017-18 | 8,281 18 | 4,423 176 | 1,110 37 | 3,313 139 | 3,858 -158 | 1,142 -33 | 2,716 -125 |
| 2018-19 | 8,010 -271 | 4,449 26 | 1,338 228 | 3,111 -202 | 3,561 -297 | 1,044 -98 | 2,517 -199 |
| 2019-20 | 7,483 -527 | 4,275 -174 | 1,295 -43 | 2,980 -131 | 3,208 -353 | 945 -99 | 2,263 -254 |
| 2020-21 | 7,208 -275 | 4,065 -210 | 1,312 17 | 2,753 -227 | 3,143 -65 | 903 -42 | 2,240 -23 |
| 2021-22 | 6,642 -566 | 3,671 -394 | 1,125 -187 | 2,546 -207 | 2,971 -172 | 799 -104 | 2,172 -68 |
| 2022-23 | 6,434 -208 | 3,718 47 | 1,171 46 | 2,547 1 | 2,716 -255 | 759 -40 | 1,957 -215 |
| Average | 7,113 | 3,699 | 1,087 | 2,611 | 3,414 | 965 | 2,449 |