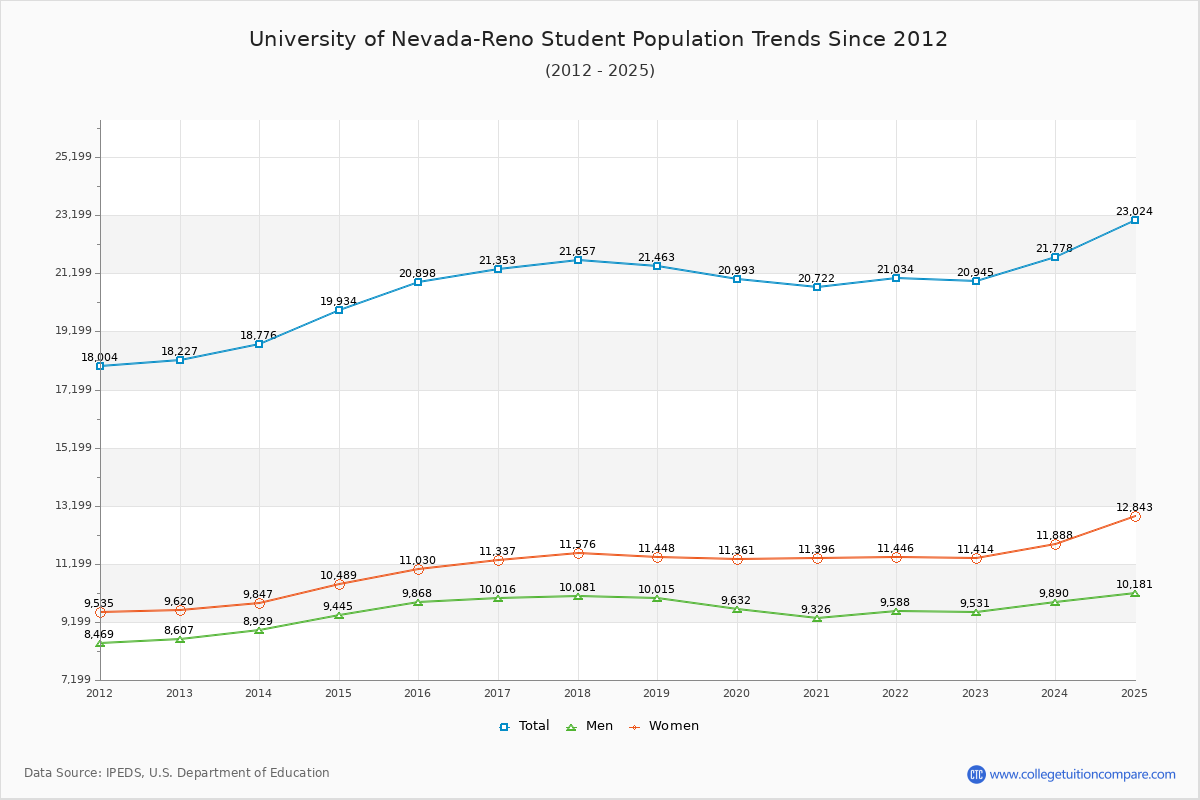
Student Population Changes
The average student population over the last 12 years is 20,546 where 20,945 students are attending the school for the academic year 2022-2023.
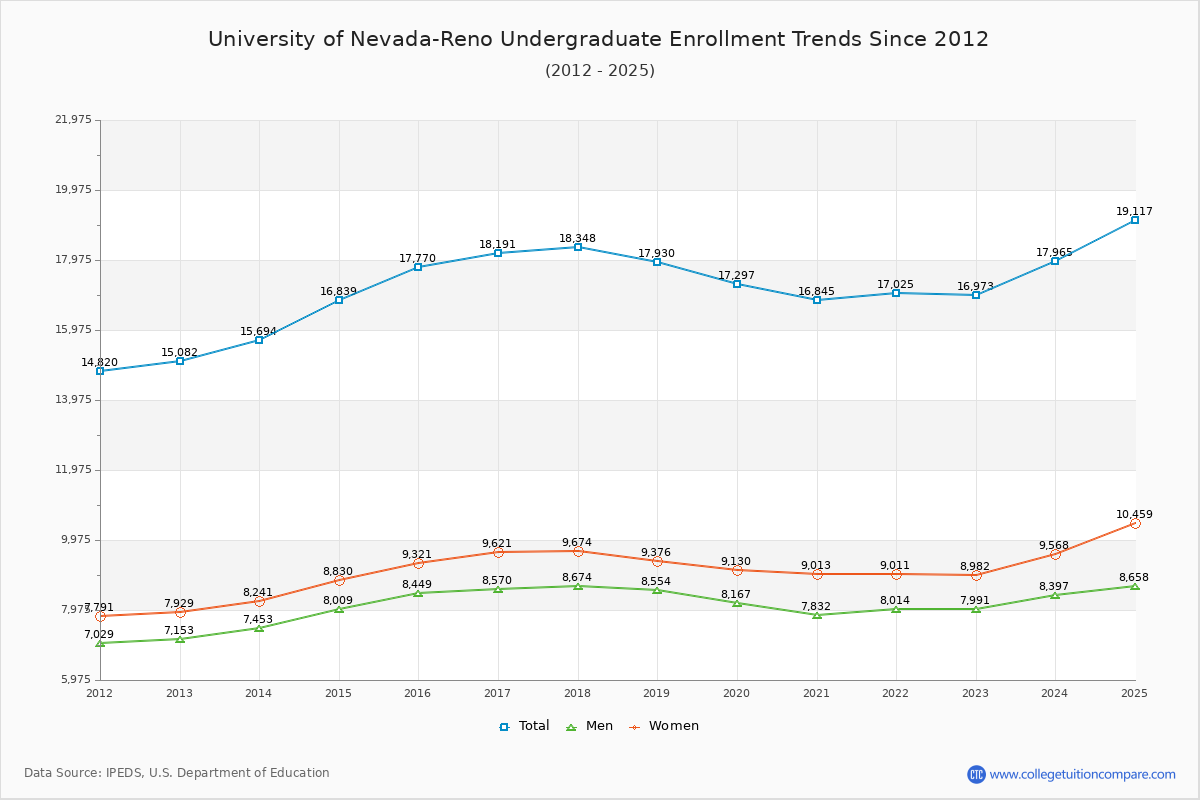
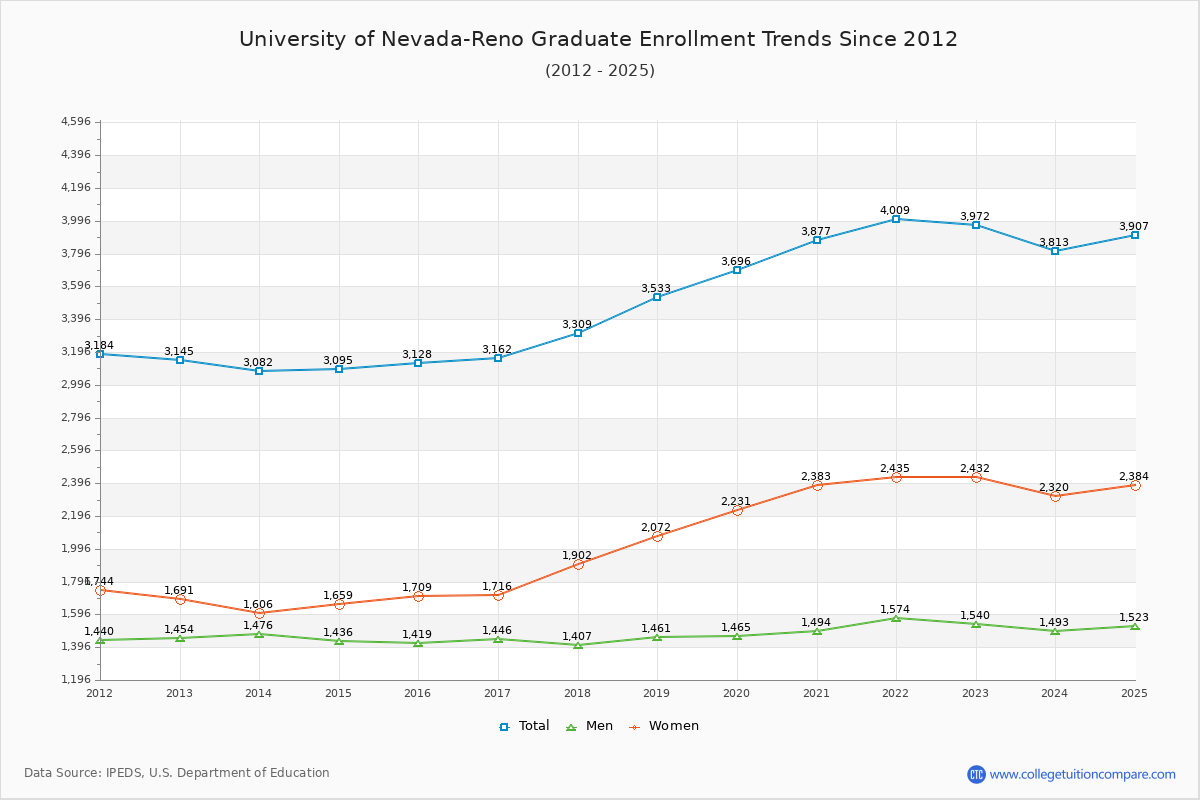
81.04% of total students is undergraduate students and 18.96% students is graduate students. The number of undergraduate students has increased by 1,891 and the graduate enrollment has increased by 827 over past 10 years.
The female to male ratio is 1.20 to 1 and it means that there are slightly more female students enrolled in U of Nevada-Reno than male students.
The following table and chart illustrate the changes in student population by gender at University of Nevada-Reno since 2012.
| Year | Total | Undergraduate | Graduate | ||||
|---|---|---|---|---|---|---|---|
| Total | Men | Women | Total | Men | Women | ||
| 2012-13 | 18,227 | 15,082 | 7,153 | 7,929 | 3,145 | 1,454 | 1,691 |
| 2013-14 | 18,776 549 | 15,694 612 | 7,453 300 | 8,241 312 | 3,082 -63 | 1,476 22 | 1,606 -85 |
| 2014-15 | 19,934 1,158 | 16,839 1,145 | 8,009 556 | 8,830 589 | 3,095 13 | 1,436 -40 | 1,659 53 |
| 2015-16 | 20,898 964 | 17,770 931 | 8,449 440 | 9,321 491 | 3,128 33 | 1,419 -17 | 1,709 50 |
| 2016-17 | 21,353 455 | 18,191 421 | 8,570 121 | 9,621 300 | 3,162 34 | 1,446 27 | 1,716 7 |
| 2017-18 | 21,657 304 | 18,348 157 | 8,674 104 | 9,674 53 | 3,309 147 | 1,407 -39 | 1,902 186 |
| 2018-19 | 21,463 -194 | 17,930 -418 | 8,554 -120 | 9,376 -298 | 3,533 224 | 1,461 54 | 2,072 170 |
| 2019-20 | 20,993 -470 | 17,297 -633 | 8,167 -387 | 9,130 -246 | 3,696 163 | 1,465 4 | 2,231 159 |
| 2020-21 | 20,722 -271 | 16,845 -452 | 7,832 -335 | 9,013 -117 | 3,877 181 | 1,494 29 | 2,383 152 |
| 2021-22 | 21,034 312 | 17,025 180 | 8,014 182 | 9,011 -2 | 4,009 132 | 1,574 80 | 2,435 52 |
| 2022-23 | 20,945 -89 | 16,973 -52 | 7,991 -23 | 8,982 -29 | 3,972 -37 | 1,540 -34 | 2,432 -3 |
| Average | 20,546 | 17,090 | 8,079 | 9,012 | 3,455 | 1,470 | 1,985 |