SAT Scores Over Time
The 2023 SAT score is at U of Nevada-Reno. Over the past 12 years, the average SAT score is 1014 (25th percentile) and 1231 (75th percentile). Compared to similar schools, the submitted SAT scores are around national average at U of Nevada-Reno.
The following table and chart illustrate the changes in SAT scores at University of Nevada-Reno since 2012.
| Year | Total | Math | Evidence-Based Reading and Writing | ||||||
|---|---|---|---|---|---|---|---|---|---|
| 25th | 50th | 75th | 25th | 50th | 75th | 25th | 50th | 75th | |
| 2012-13 | 950 | 1,065 | 1,180 | 480 | 540 | 600 | 470 | 525 | 580 |
| 2013-14 | 960 | 1,075 | 1,190 | 480 | 540 | 600 | 480 | 535 | 590 |
| 2014-15 | 960 | 1,075 | 1,190 | 480 | 540 | 600 | 480 | 535 | 590 |
| 2015-16 | 970 | 1,080 | 1,190 | 490 | 545 | 600 | 480 | 535 | 590 |
| 2016-17 | 970 | 1,085 | 1,200 | 490 | 550 | 610 | 480 | 535 | 590 |
| 2017-18 | 1,070 | 1,165 | 1,260 | 530 | 580 | 630 | 540 | 585 | 630 |
| 2018-19 | 1,070 | 1,175 | 1,280 | 530 | 585 | 640 | 540 | 590 | 640 |
| 2019-20 | 1,070 | 1,180 | 1,290 | 530 | 590 | 650 | 540 | 590 | 640 |
| 2020-21 | 1,060 | 1,160 | 1,260 | 530 | 580 | 630 | 530 | 580 | 630 |
| 2021-22 | 1,060 | 1,165 | 1,270 | 530 | 580 | 630 | 530 | 585 | 640 |
| 2022-23 | - | - | - | - | - | - | - | - | - |
| Average | 1014 | 1123 | 1231 | 507 | 563 | 619 | 507 | 560 | 612 |
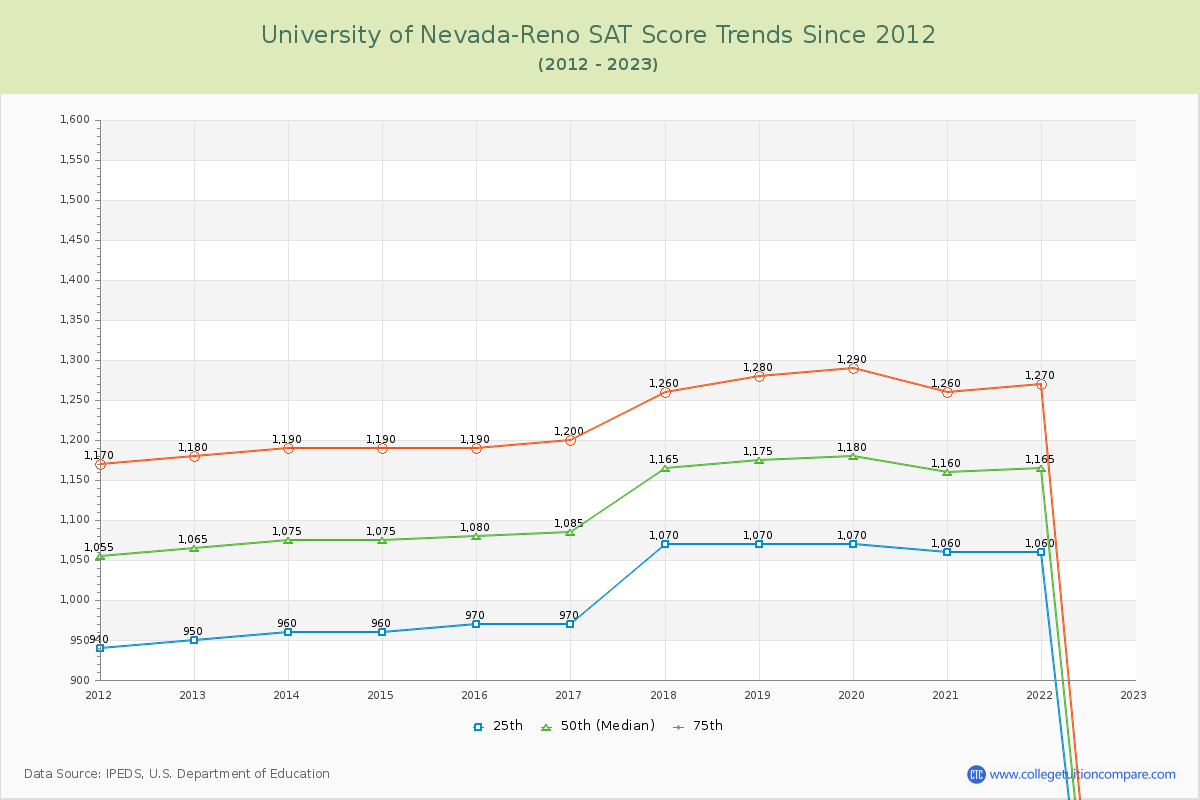
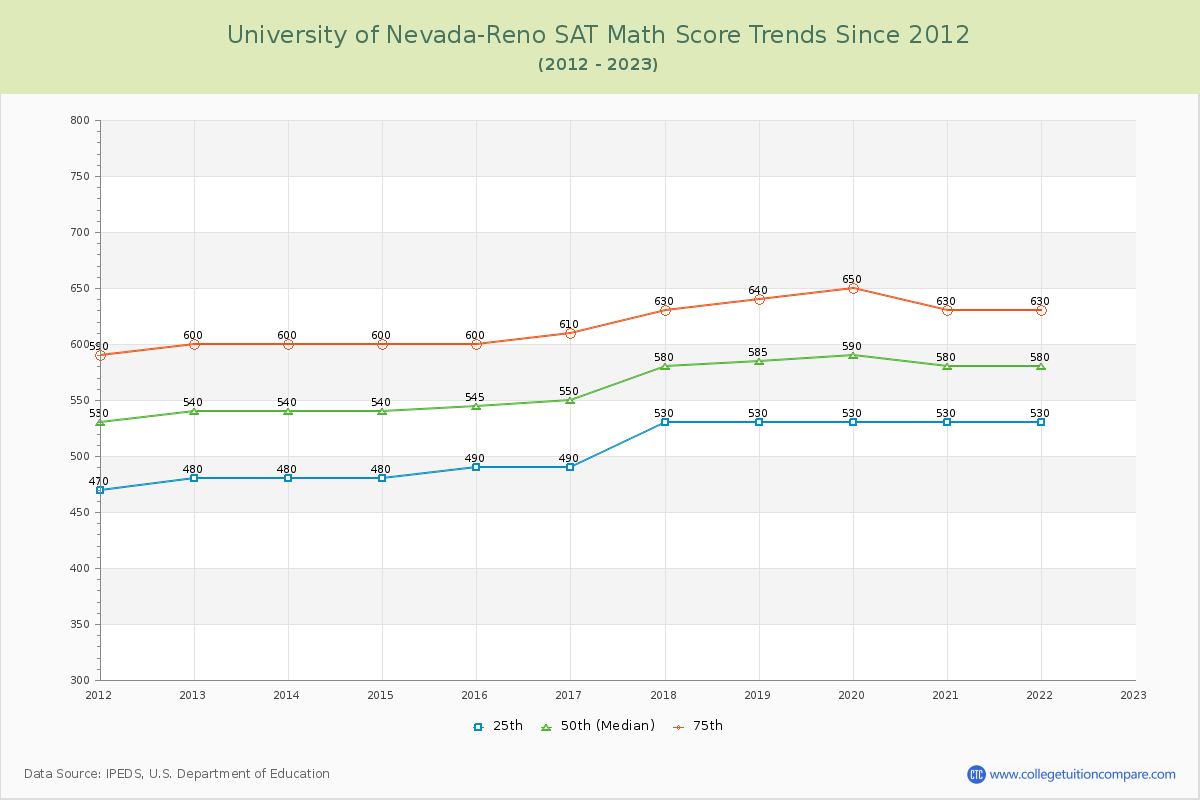
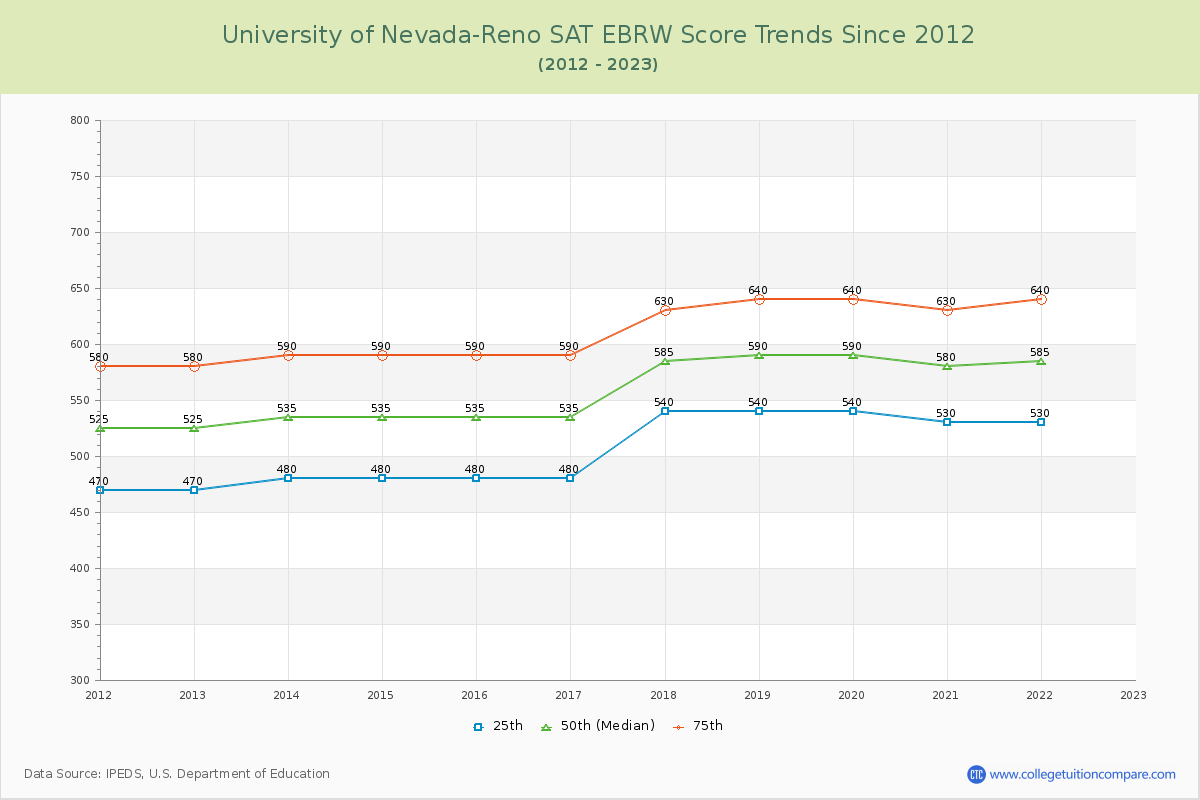
*SAT Evidence-Based Reading and Writing replaces SAT critical reading and writing since year 2017.
**The SAT Writing score is excluded from the total scores for year from 2011 to 2016.