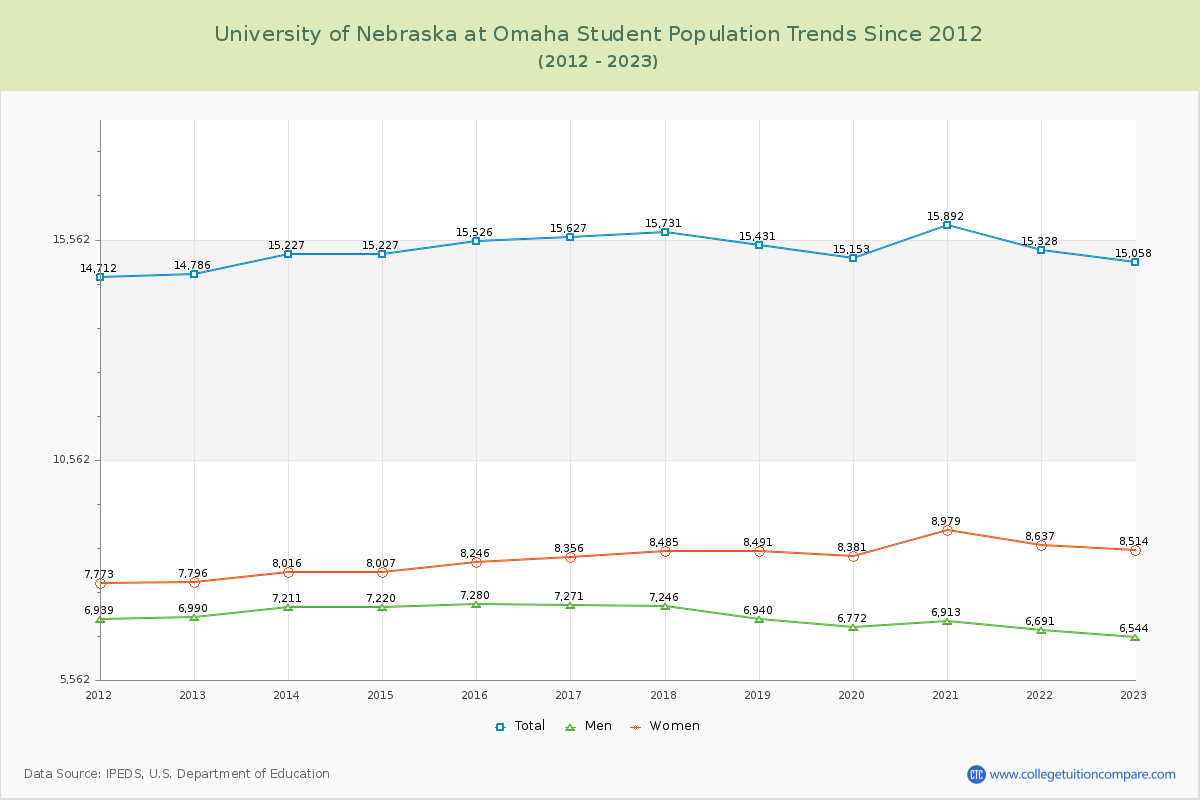
Student Population Changes
The average student population over the last 12 years is 15,362 where 15,058 students are attending the school for the academic year 2022-2023.
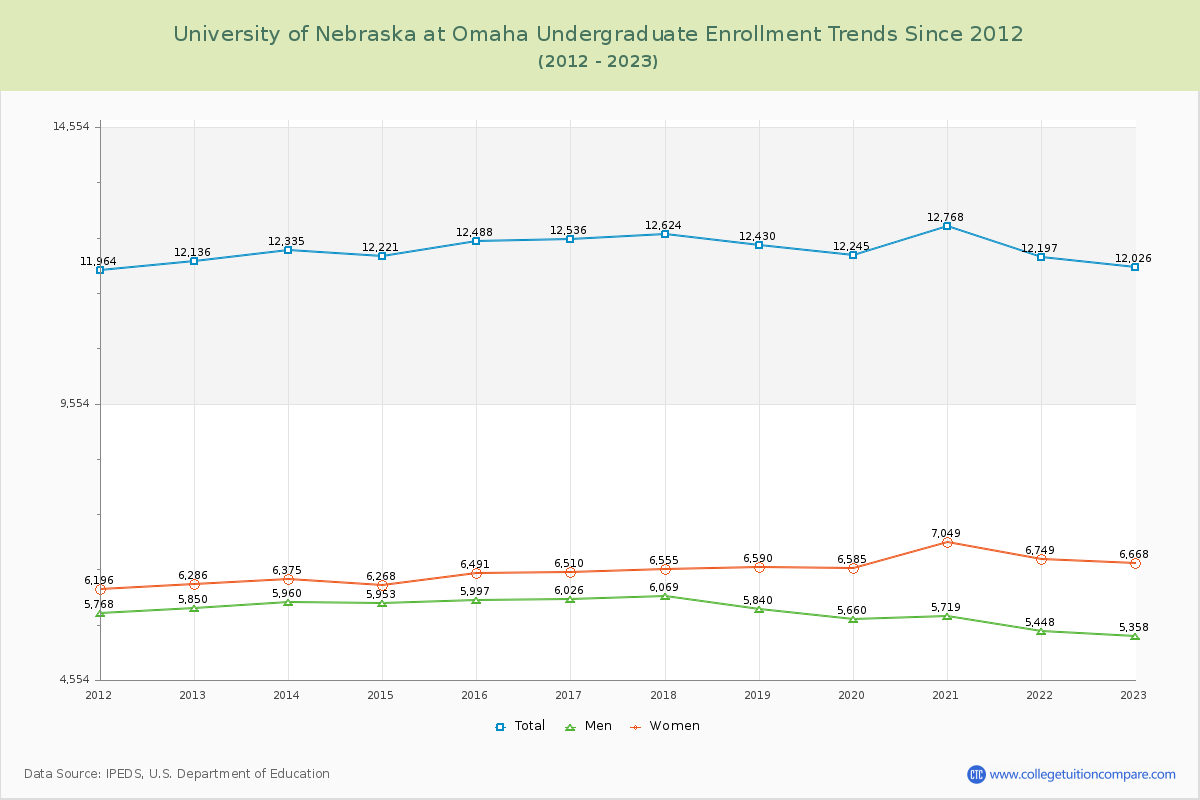
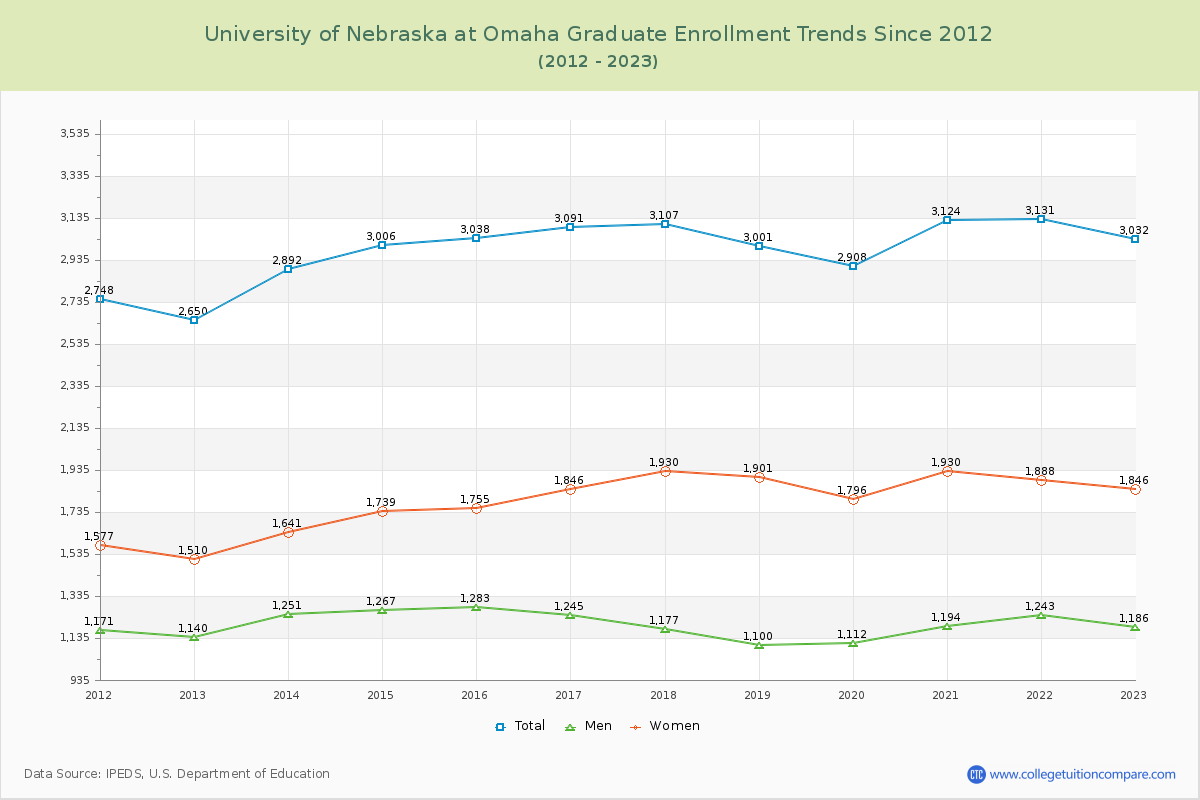
79.86% of total students is undergraduate students and 20.14% students is graduate students. The number of undergraduate students has decreased by 110 and the graduate enrollment has increased by 382 over past 10 years.
The female to male ratio is 1.30 to 1 and it means that there are slightly more female students enrolled in UNOMAHA than male students.
The following table and chart illustrate the changes in student population by gender at University of Nebraska at Omaha since 2012.
| Year | Total | Undergraduate | Graduate | ||||
|---|---|---|---|---|---|---|---|
| Total | Men | Women | Total | Men | Women | ||
| 2012-13 | 14,786 | 12,136 | 5,850 | 6,286 | 2,650 | 1,140 | 1,510 |
| 2013-14 | 15,227 441 | 12,335 199 | 5,960 110 | 6,375 89 | 2,892 242 | 1,251 111 | 1,641 131 |
| 2014-15 | 15,227 0 | 12,221 -114 | 5,953 -7 | 6,268 -107 | 3,006 114 | 1,267 16 | 1,739 98 |
| 2015-16 | 15,526 299 | 12,488 267 | 5,997 44 | 6,491 223 | 3,038 32 | 1,283 16 | 1,755 16 |
| 2016-17 | 15,627 101 | 12,536 48 | 6,026 29 | 6,510 19 | 3,091 53 | 1,245 -38 | 1,846 91 |
| 2017-18 | 15,731 104 | 12,624 88 | 6,069 43 | 6,555 45 | 3,107 16 | 1,177 -68 | 1,930 84 |
| 2018-19 | 15,431 -300 | 12,430 -194 | 5,840 -229 | 6,590 35 | 3,001 -106 | 1,100 -77 | 1,901 -29 |
| 2019-20 | 15,153 -278 | 12,245 -185 | 5,660 -180 | 6,585 -5 | 2,908 -93 | 1,112 12 | 1,796 -105 |
| 2020-21 | 15,892 739 | 12,768 523 | 5,719 59 | 7,049 464 | 3,124 216 | 1,194 82 | 1,930 134 |
| 2021-22 | 15,328 -564 | 12,197 -571 | 5,448 -271 | 6,749 -300 | 3,131 7 | 1,243 49 | 1,888 -42 |
| 2022-23 | 15,058 -270 | 12,026 -171 | 5,358 -90 | 6,668 -81 | 3,032 -99 | 1,186 -57 | 1,846 -42 |
| Average | 15,362 | 12,364 | 5,807 | 6,557 | 2,998 | 1,200 | 1,798 |