SAT Scores Over Time
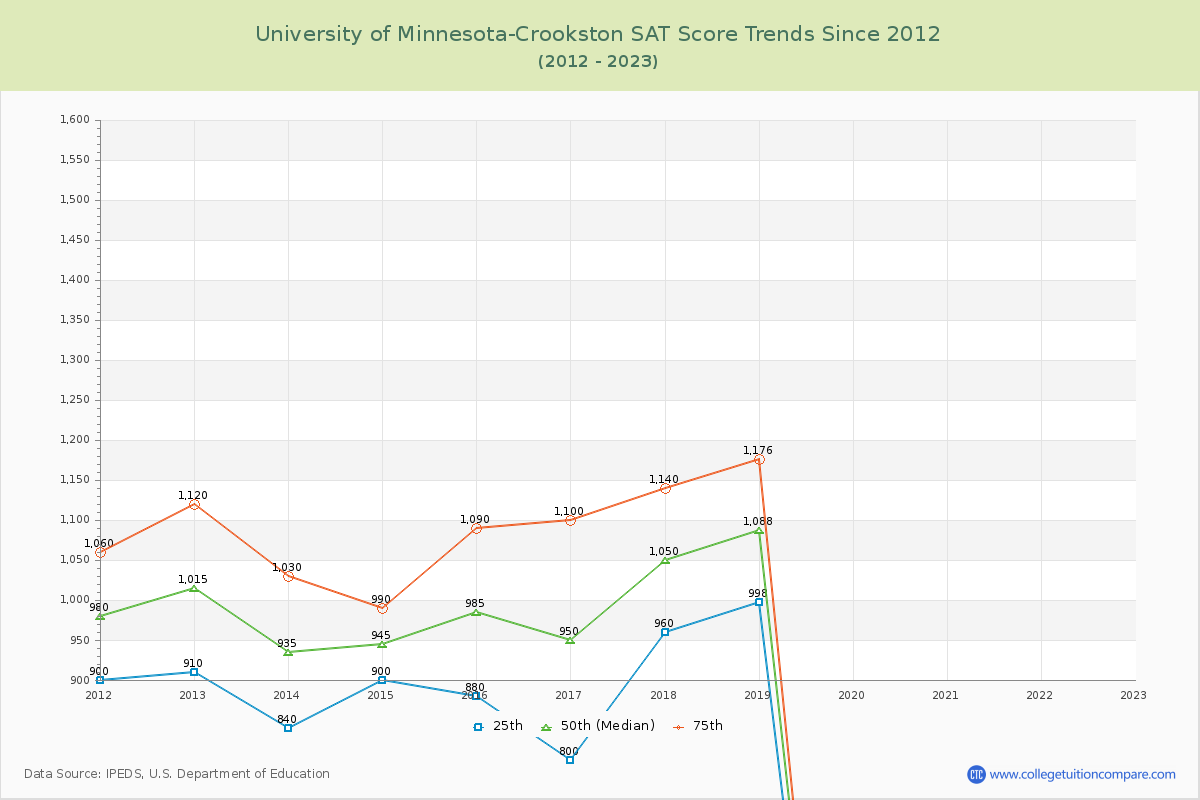
The 2023 SAT score is at U of Minnesota-Crookston. Over the past 12 years, the average SAT score is 898 (25th percentile) and 1092 (75th percentile). Compared to similar schools, the submitted SAT scores are around national average at U of Minnesota-Crookston.
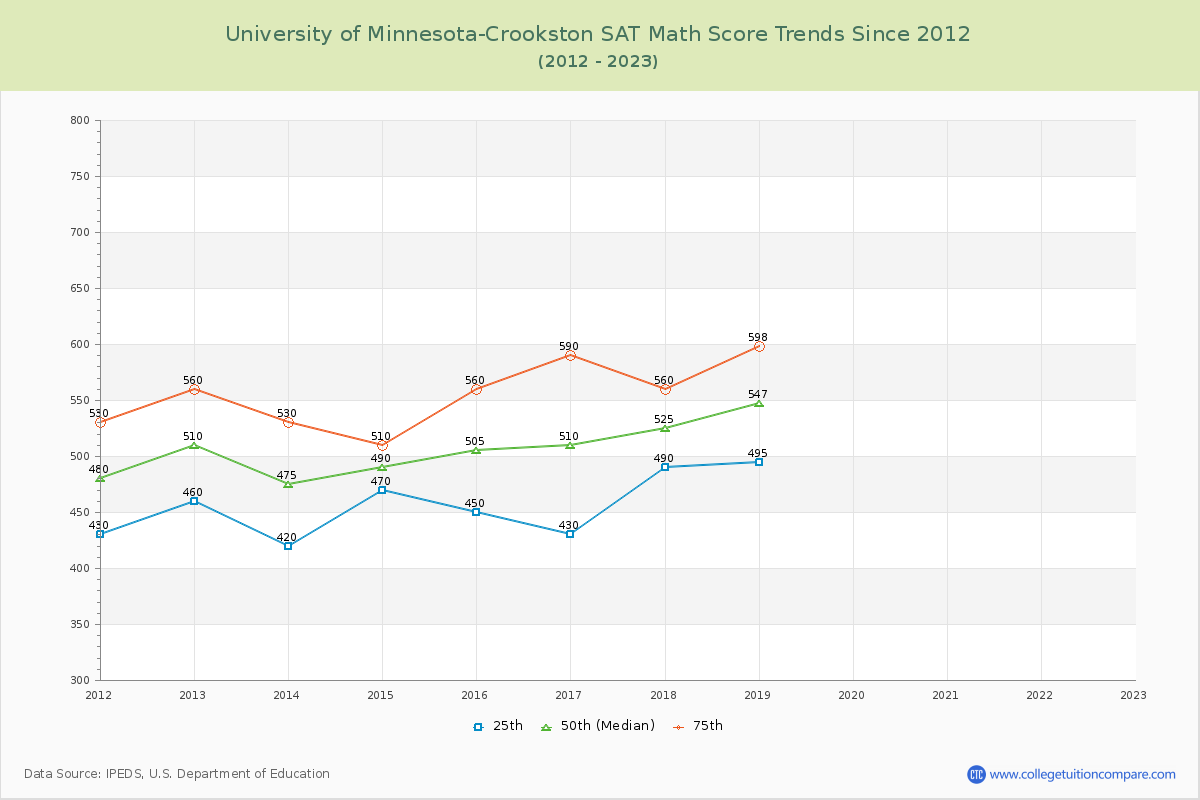
The following table and chart illustrate the changes in SAT scores at University of Minnesota-Crookston since 2012.
| Year | Total | Math | Evidence-Based Reading and Writing | ||||||
|---|---|---|---|---|---|---|---|---|---|
| 25th | 50th | 75th | 25th | 50th | 75th | 25th | 50th | 75th | |
| 2012-13 | 910 | 1,015 | 1,120 | 460 | 510 | 560 | 450 | 505 | 560 |
| 2013-14 | 840 | 935 | 1,030 | 420 | 475 | 530 | 420 | 460 | 500 |
| 2014-15 | 900 | 945 | 990 | 470 | 490 | 510 | 430 | 455 | 480 |
| 2015-16 | 880 | 985 | 1,090 | 450 | 505 | 560 | 430 | 480 | 530 |
| 2016-17 | 800 | 950 | 1,100 | 430 | 510 | 590 | 370 | 440 | 510 |
| 2017-18 | 960 | 1,050 | 1,140 | 490 | 525 | 560 | 470 | 525 | 580 |
| 2018-19 | 998 | 1,087 | 1,176 | 495 | 547 | 598 | 503 | 541 | 578 |
| 2019-20 | - | - | - | - | - | - | - | - | - |
| 2020-21 | - | - | - | - | - | - | - | - | - |
| 2021-22 | - | - | - | - | - | - | - | - | - |
| 2022-23 | - | - | - | - | - | - | - | - | - |
| Average | 898 | 995 | 1092 | 459 | 509 | 558 | 439 | 487 | 534 |
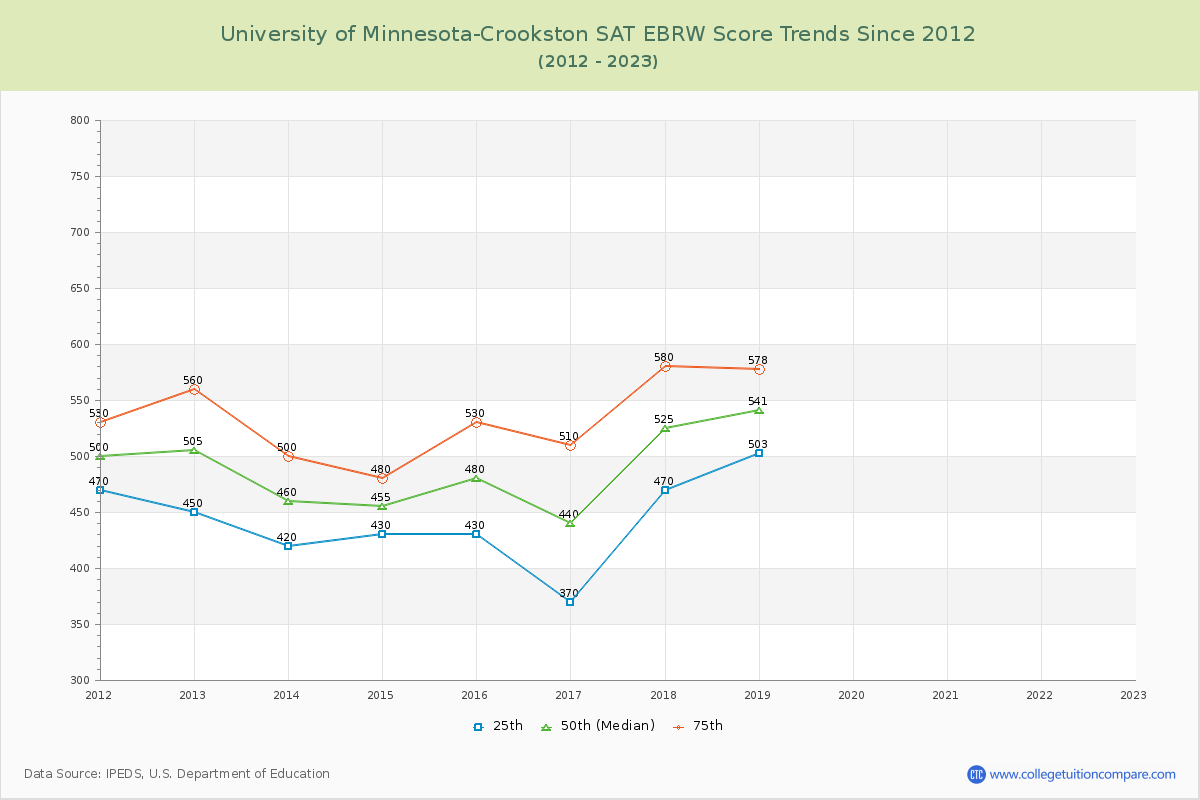
*SAT Evidence-Based Reading and Writing replaces SAT critical reading and writing since year 2017.
**The SAT Writing score is excluded from the total scores for year from 2011 to 2016.