Student Population Changes
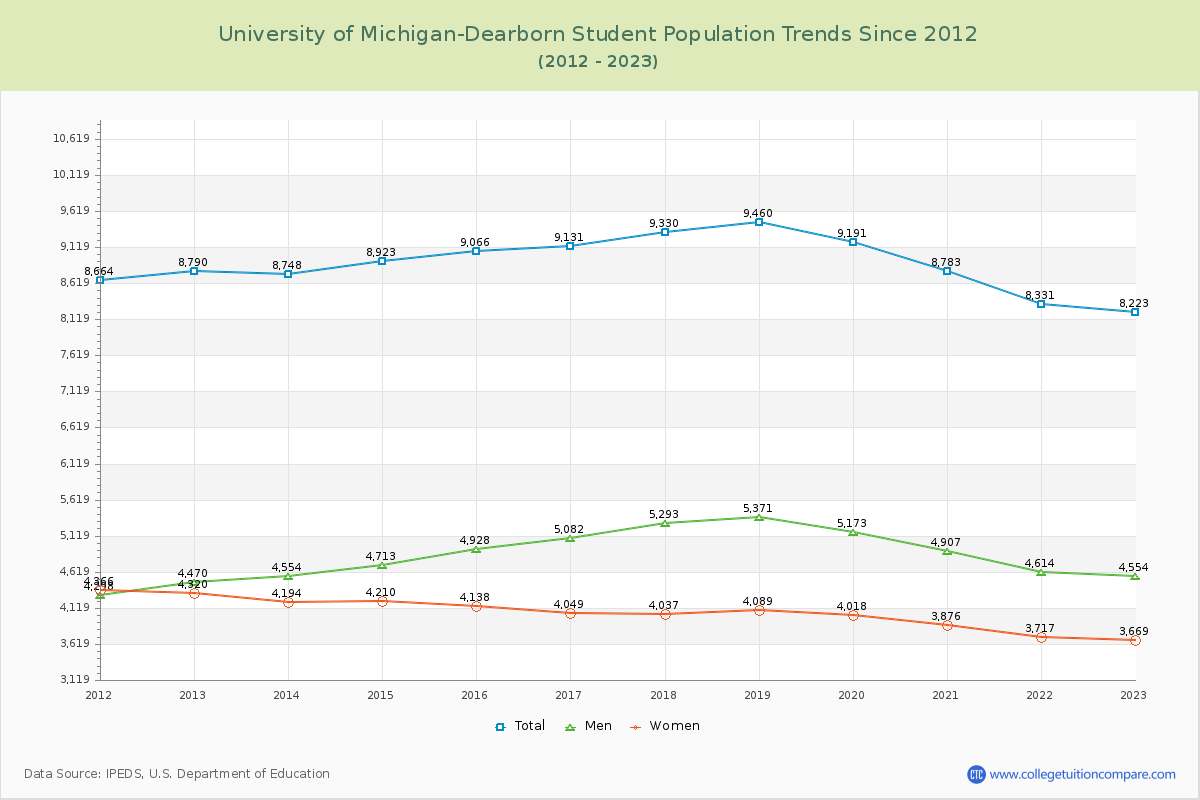
The average student population over the last 12 years is 8,907 where 8,223 students are attending the school for the academic year 2022-2023.
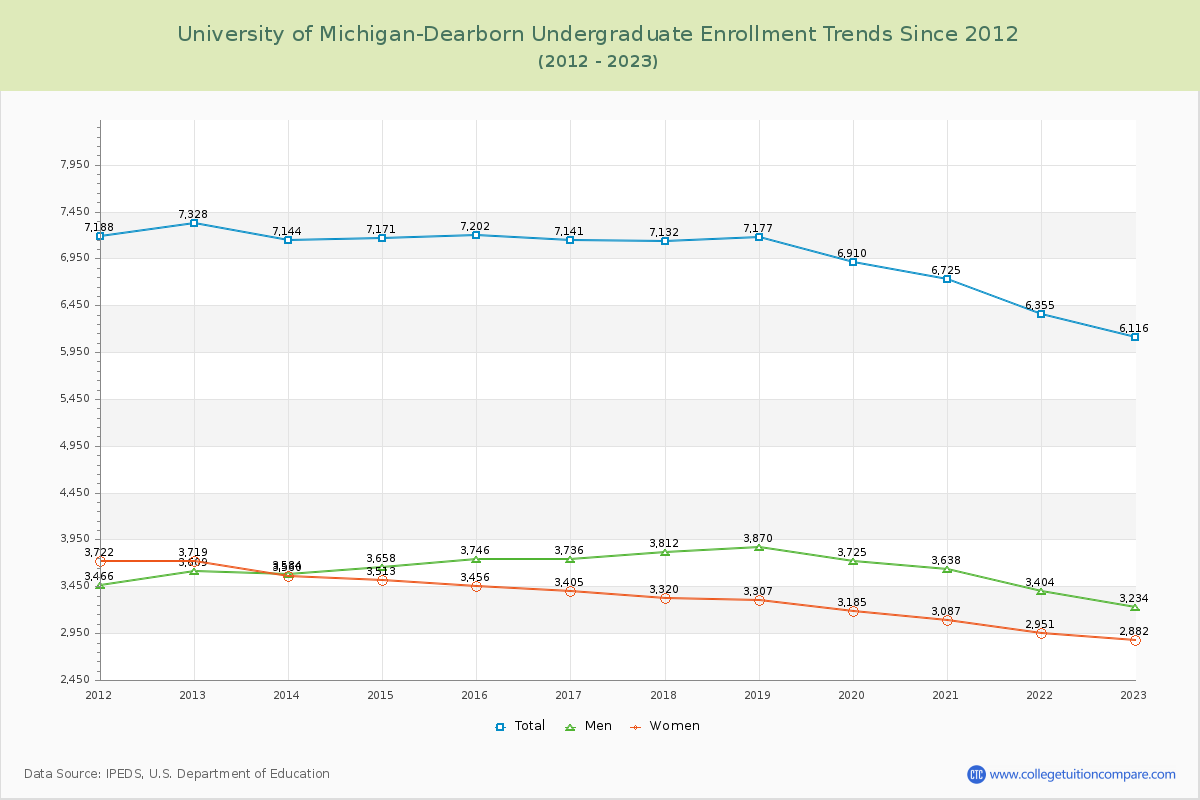
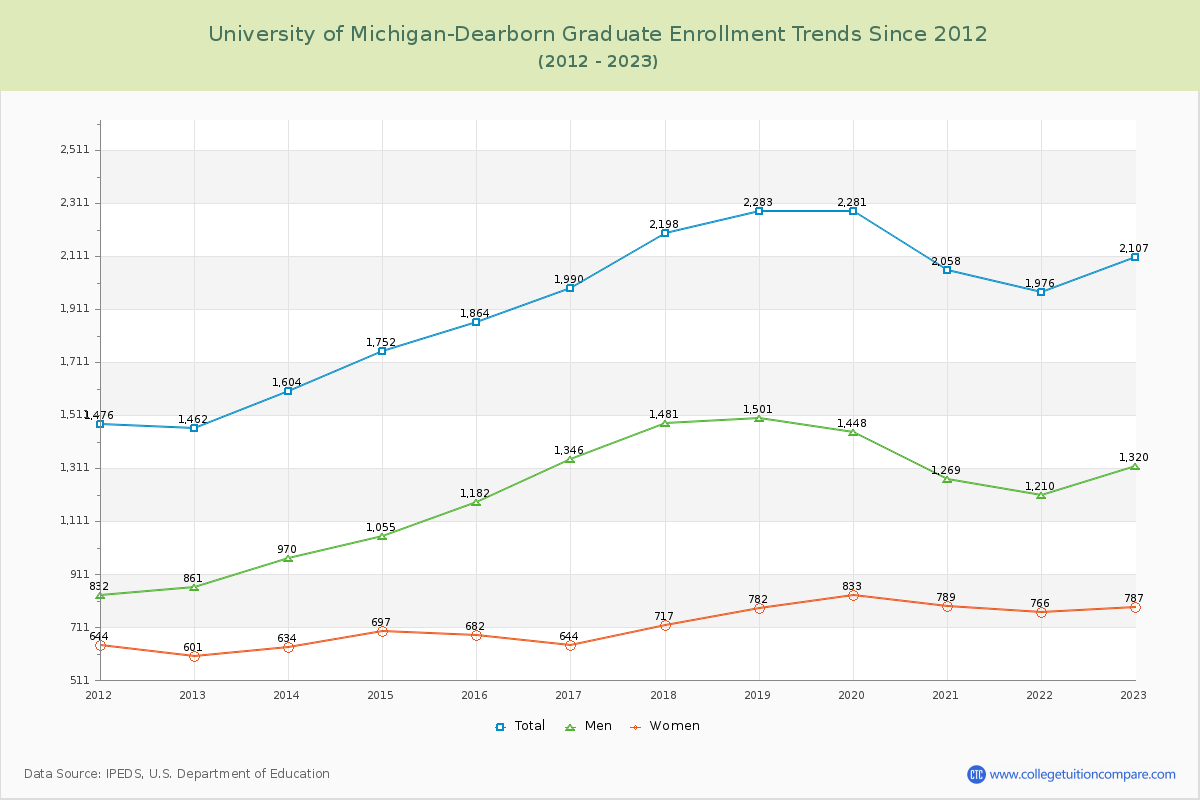
74.38% of total students is undergraduate students and 25.62% students is graduate students. The number of undergraduate students has decreased by 1,212 and the graduate enrollment has increased by 645 over past 10 years.
The female to male ratio is 0.81 to 1 and it means that there are slightly more male students enrolled in UM-Dearborn than female students.
The following table and chart illustrate the changes in student population by gender at University of Michigan-Dearborn since 2012.
| Year | Total | Undergraduate | Graduate | ||||
|---|---|---|---|---|---|---|---|
| Total | Men | Women | Total | Men | Women | ||
| 2012-13 | 8,790 | 7,328 | 3,609 | 3,719 | 1,462 | 861 | 601 |
| 2013-14 | 8,748 -42 | 7,144 -184 | 3,584 -25 | 3,560 -159 | 1,604 142 | 970 109 | 634 33 |
| 2014-15 | 8,923 175 | 7,171 27 | 3,658 74 | 3,513 -47 | 1,752 148 | 1,055 85 | 697 63 |
| 2015-16 | 9,066 143 | 7,202 31 | 3,746 88 | 3,456 -57 | 1,864 112 | 1,182 127 | 682 -15 |
| 2016-17 | 9,131 65 | 7,141 -61 | 3,736 -10 | 3,405 -51 | 1,990 126 | 1,346 164 | 644 -38 |
| 2017-18 | 9,330 199 | 7,132 -9 | 3,812 76 | 3,320 -85 | 2,198 208 | 1,481 135 | 717 73 |
| 2018-19 | 9,460 130 | 7,177 45 | 3,870 58 | 3,307 -13 | 2,283 85 | 1,501 20 | 782 65 |
| 2019-20 | 9,191 -269 | 6,910 -267 | 3,725 -145 | 3,185 -122 | 2,281 -2 | 1,448 -53 | 833 51 |
| 2020-21 | 8,783 -408 | 6,725 -185 | 3,638 -87 | 3,087 -98 | 2,058 -223 | 1,269 -179 | 789 -44 |
| 2021-22 | 8,331 -452 | 6,355 -370 | 3,404 -234 | 2,951 -136 | 1,976 -82 | 1,210 -59 | 766 -23 |
| 2022-23 | 8,223 -108 | 6,116 -239 | 3,234 -170 | 2,882 -69 | 2,107 131 | 1,320 110 | 787 21 |
| Average | 8,907 | 6,946 | 3,638 | 3,308 | 1,961 | 1,240 | 721 |