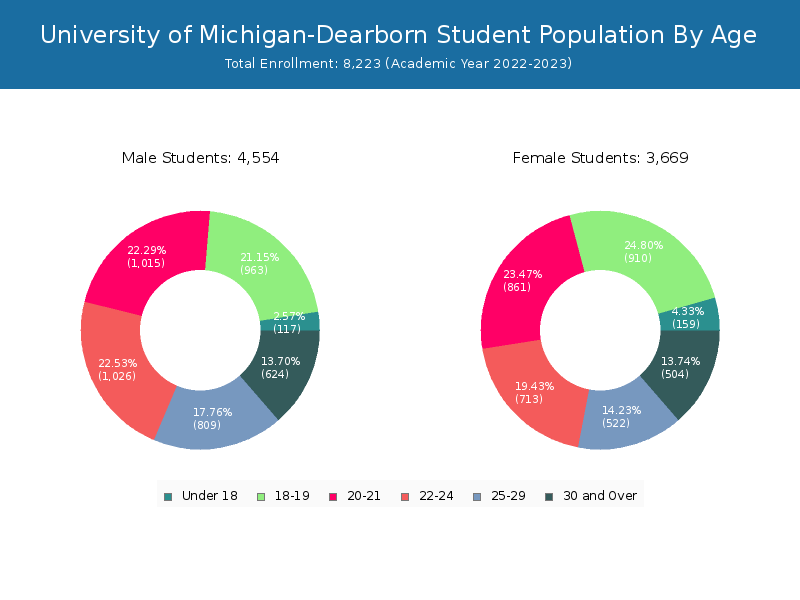
Student Population by Gender
University of Michigan-Dearborn has a total of 8,223 enrolled students for the academic year 2022-2023. 6,116 students have enrolled in undergraduate programs and 2,107 students joined graduate programs.
By gender, 4,554 male and 3,669 female students (the male-female ratio is 55:45) are attending the school. The gender distribution is based on the 2022-2023 data.
| Total | Undergraduate | Graduate | |
|---|---|---|---|
| Total | 8,223 | 6,116 | 2,107 |
| Men | 4,554 | 3,234 | 1,320 |
| Women | 3,669 | 2,882 | 787 |
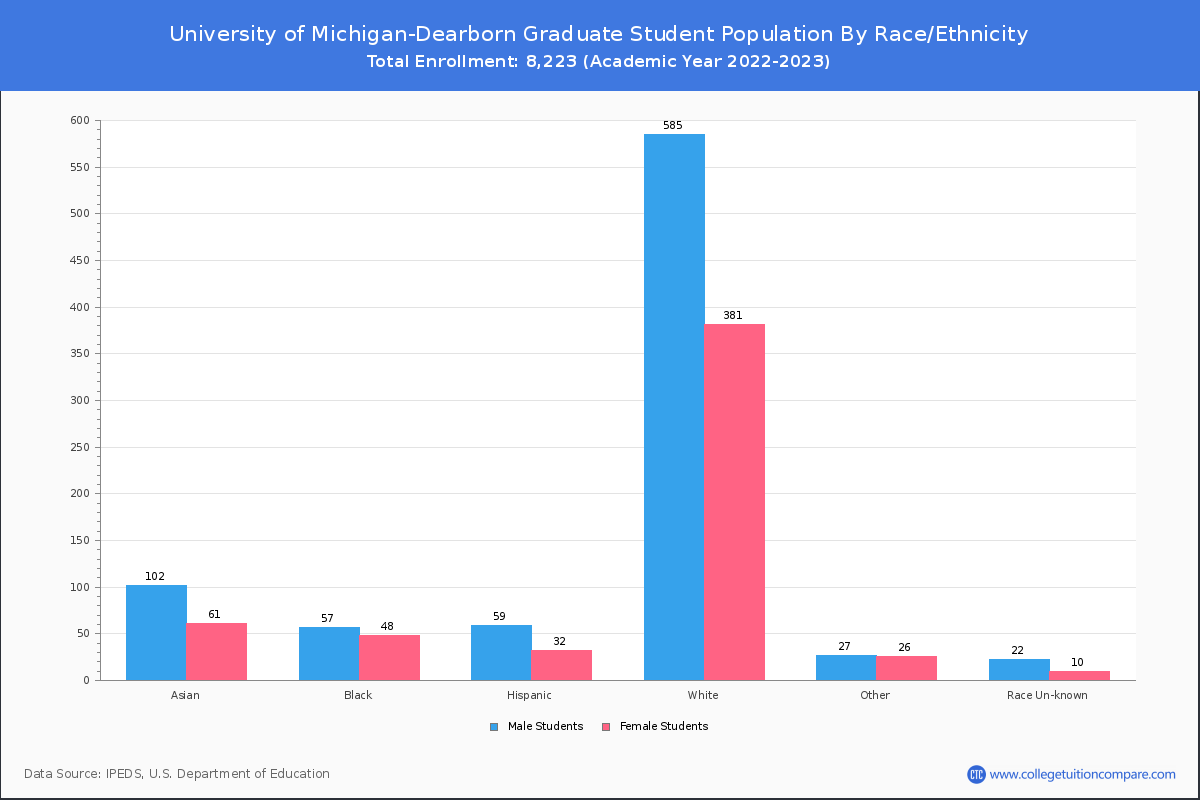
Student Distribution by Race/Ethnicity
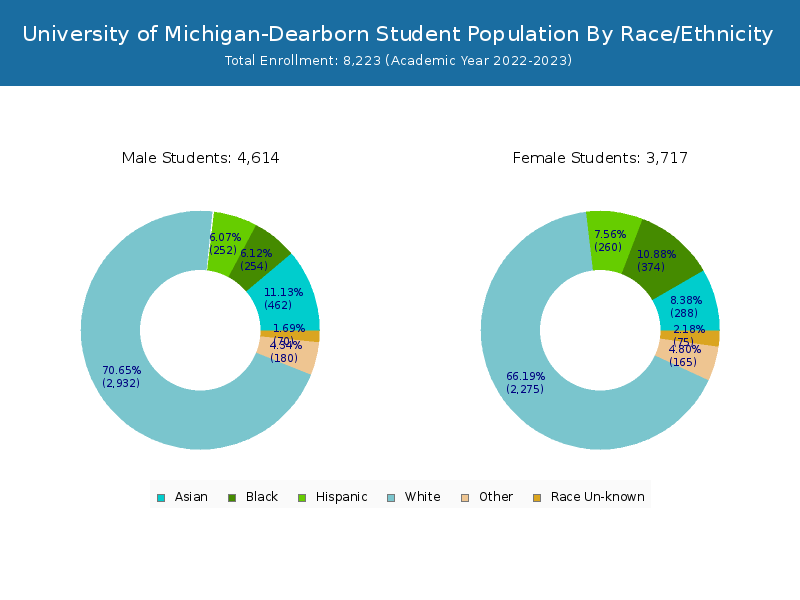
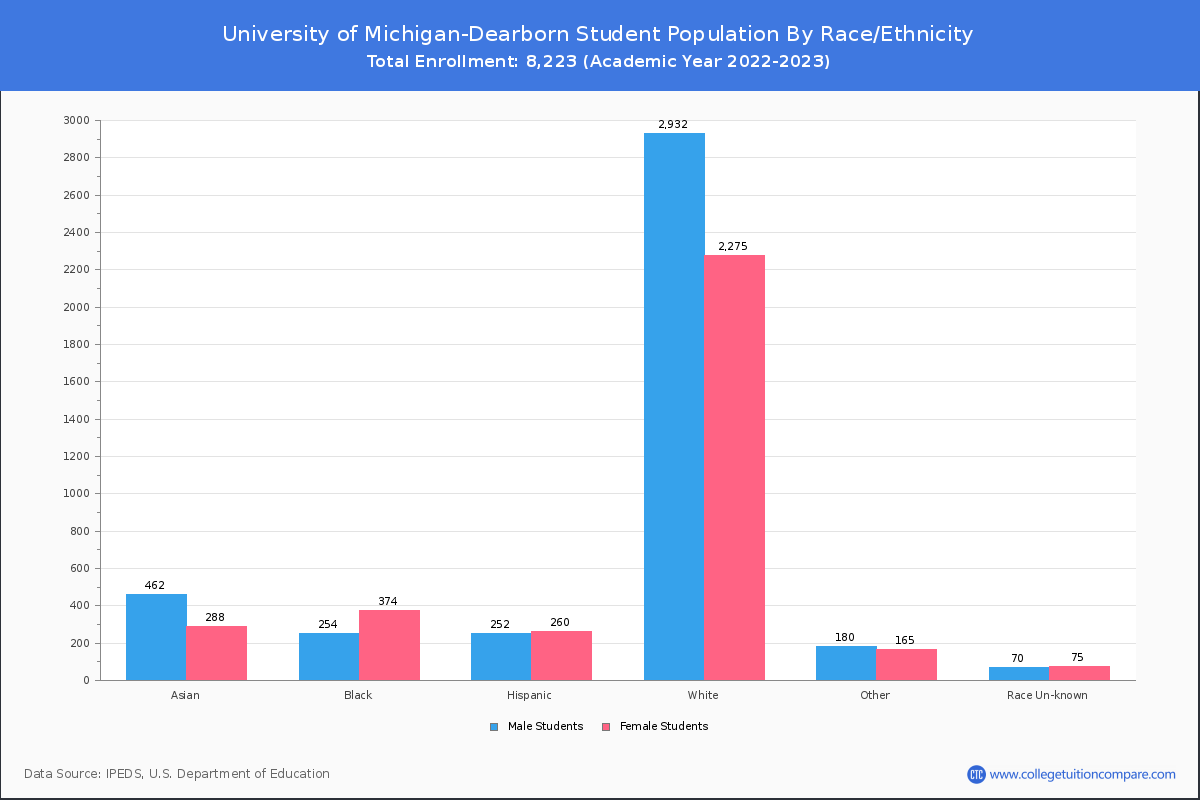
By race/ethnicity, 4,861 White, 596 Black, and 716 Asian students out of a total of 8,223 are attending at University of Michigan-Dearborn. Comprehensive enrollment statistic data by race/ethnicity is shown in the next chart (Academic year 2022-2023 data).
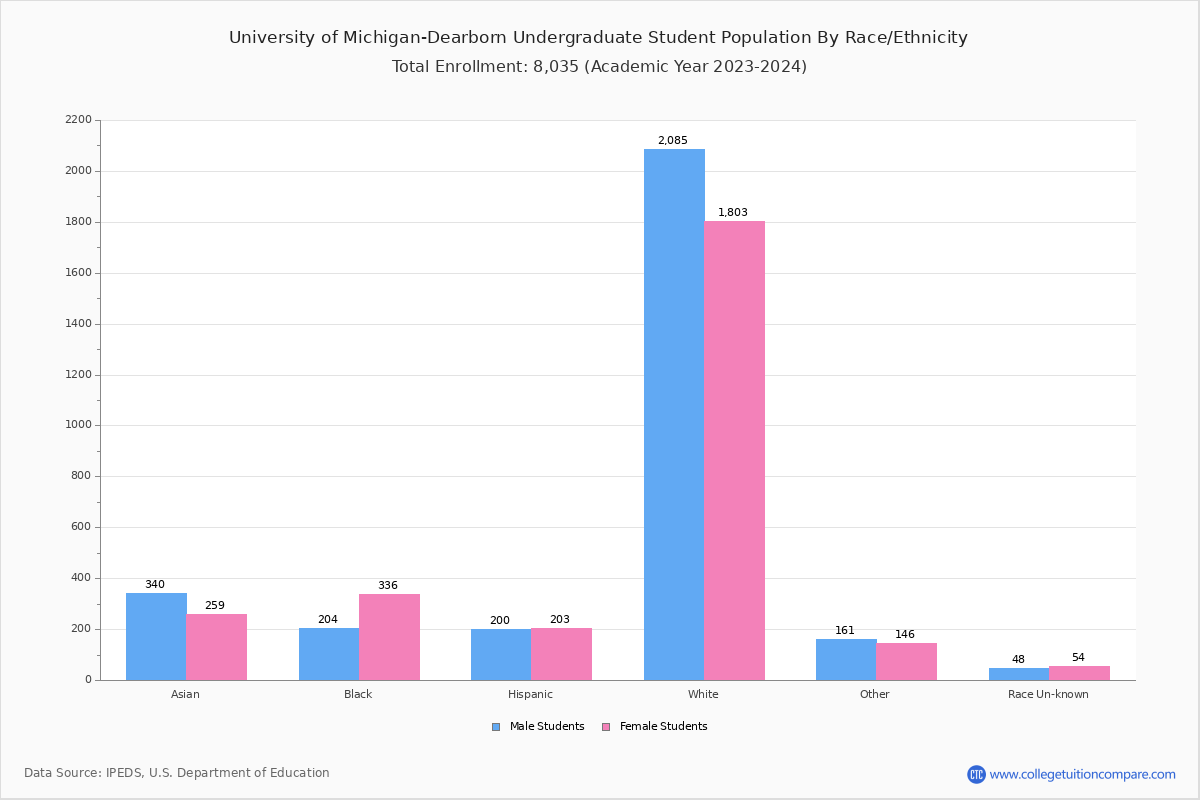
| Race | Total | Men | Women |
|---|---|---|---|
| American Indian or Native American | 12 | 6 | 6 |
| Asian | 716 | 425 | 291 |
| Black | 596 | 240 | 356 |
| Hispanic | 511 | 252 | 259 |
| Native Hawaiian or Other Pacific Islanders | 4 | 2 | 2 |
| White | 4,861 | 2,730 | 2,131 |
| Two or more races | 333 | 168 | 165 |
| Race Unknown | 137 | 67 | 70 |
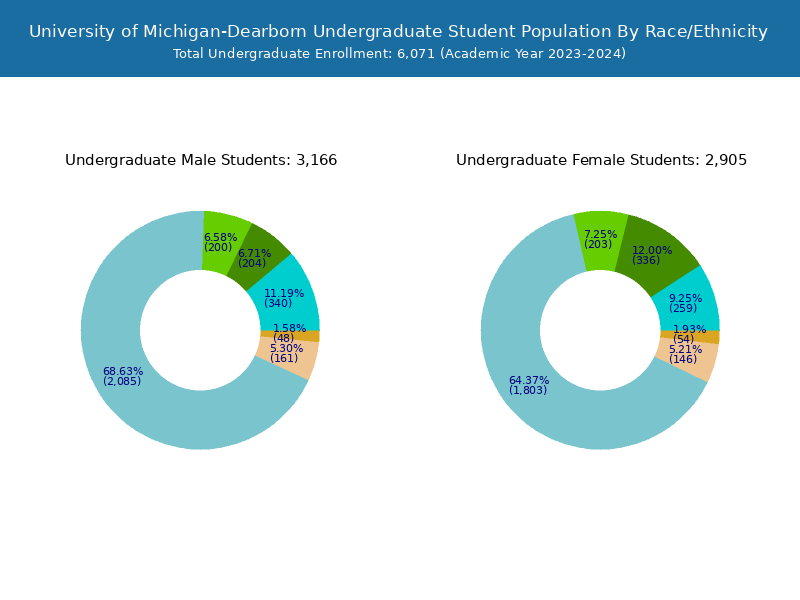
| Race | Total | Men | Women |
|---|---|---|---|
| American Indian or Native American | 9 | 4 | 5 |
| Asian | 569 | 336 | 233 |
| Black | 496 | 191 | 305 |
| Hispanic | 432 | 200 | 232 |
| Native Hawaiian or Other Pacific Islanders | 2 | 1 | 1 |
| White | 4,023 | 2,206 | 1,817 |
| Two or more races | 290 | 150 | 140 |
| Race Unknown | 108 | 47 | 61 |
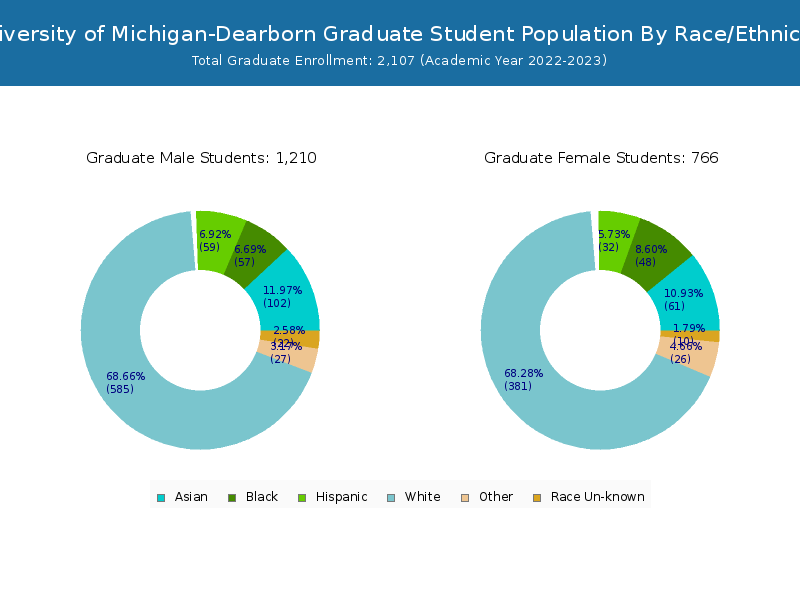
| Race | Total | Men | Women |
|---|---|---|---|
| American Indian or Native American | 2 | 2 | 0 |
| Asian | 46 | 32 | 14 |
| Black | 39 | 8 | 31 |
| Hispanic | 26 | 10 | 16 |
| Native Hawaiian or Other Pacific Islanders | 0 | 0 | 0 |
| White | 352 | 182 | 170 |
| Two or more races | 23 | 15 | 8 |
| Race Unknown | 18 | 10 | 8 |
Student Age Distribution
By age, UM-Dearborn has 276 students under 18 years old and 9 students over 65 years old. There are 5,764 students under 25 years old, and 2,459 students over 25 years old out of 8,223 total students.
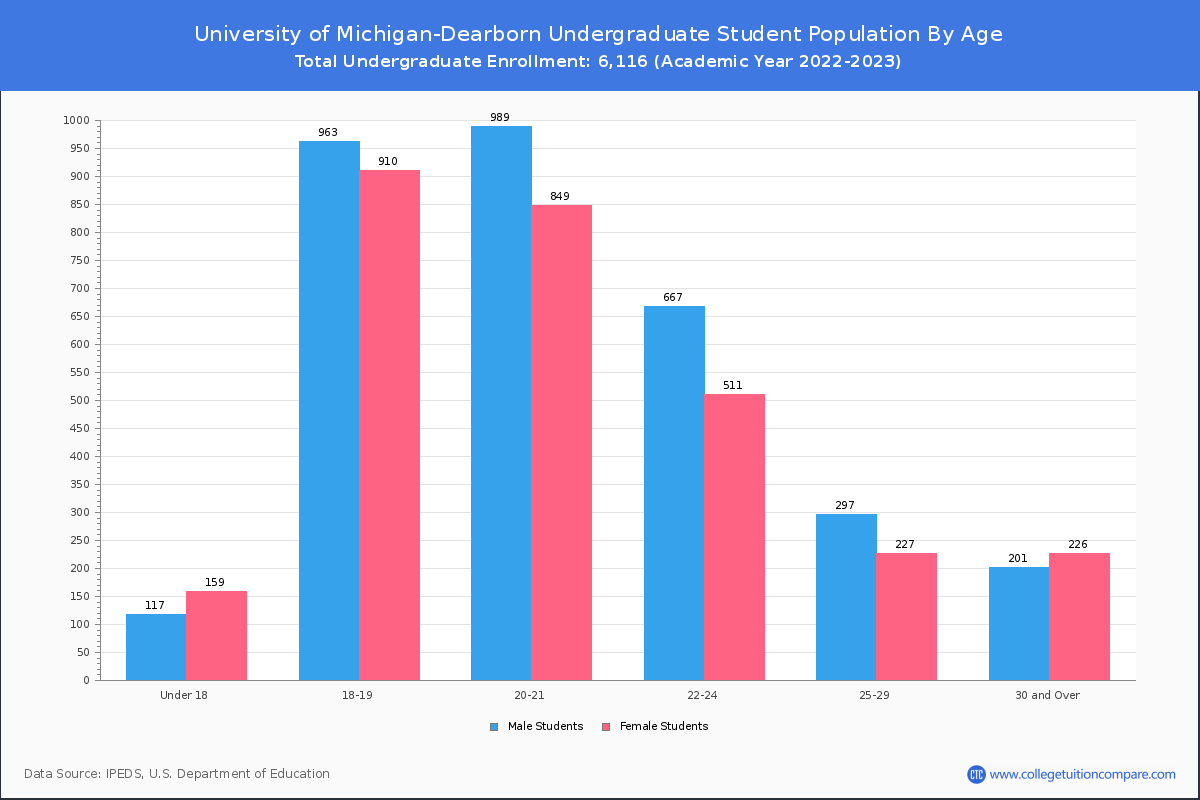
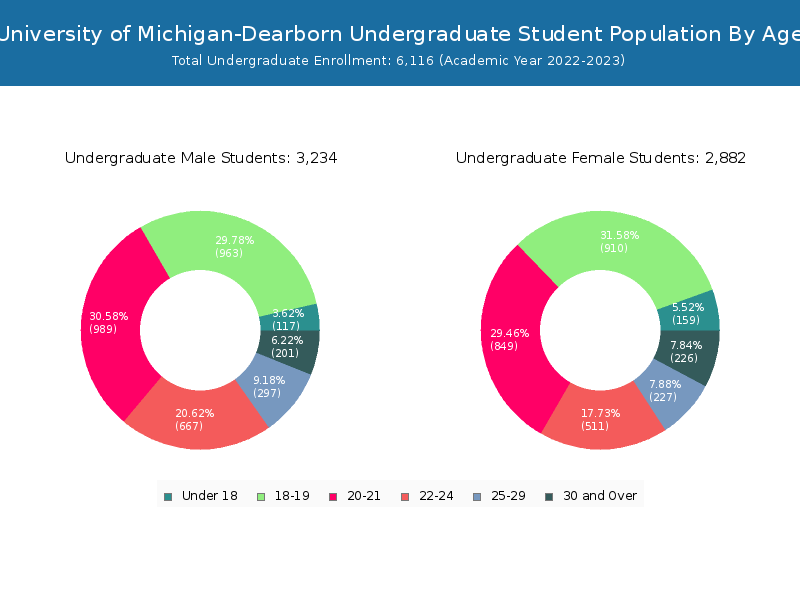
In undergraduate programs, 276 students are younger than 18 and 7 students are older than 65. UM-Dearborn has 5,165 undergraduate students aged under 25 and 951 students aged 25 and over.
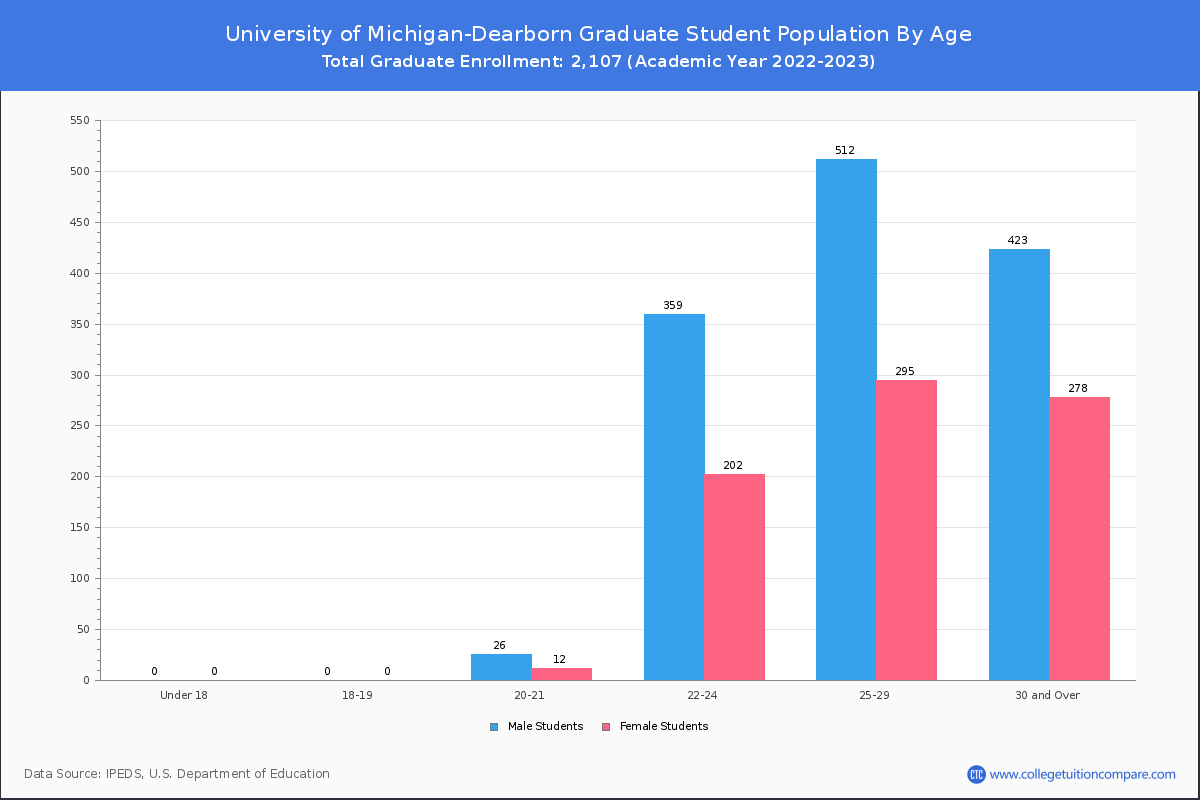
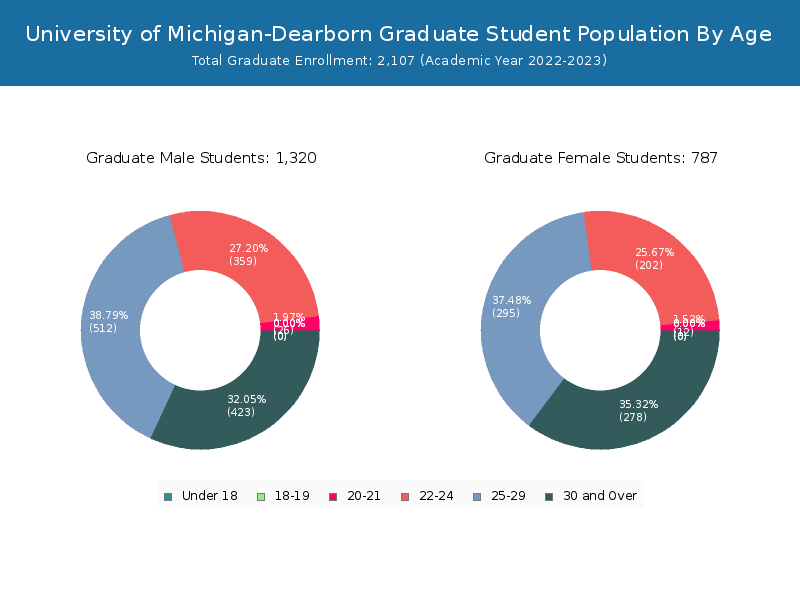
It has 599 graduate students aged under 25 and 1,508 students aged 25 and over.
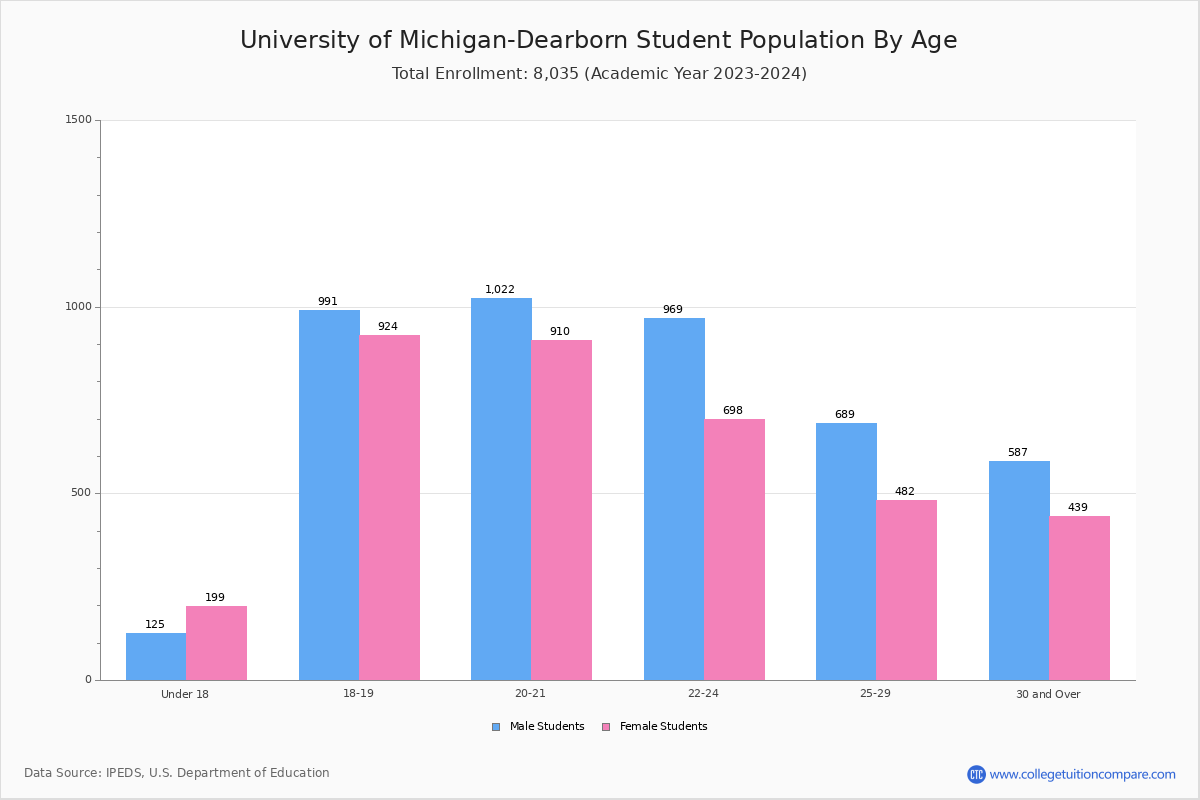
| Age | Total | Men | Women |
|---|---|---|---|
| Under 18 | 276 | 159 | 117 |
| 18-19 | 1,873 | 910 | 963 |
| 20-21 | 1,876 | 861 | 1,015 |
| 22-24 | 1,739 | 713 | 1,026 |
| 25-29 | 1,331 | 522 | 809 |
| 30-34 | 566 | 232 | 334 |
| 35-39 | 229 | 103 | 126 |
| 40-49 | 236 | 117 | 119 |
| 50-64 | 88 | 50 | 38 |
| Over 65 | 9 | 2 | 7 |
| Age | Total | Men | Women |
|---|---|---|---|
| Under 18 | 276 | 159 | 117 |
| 18-19 | 1,873 | 910 | 963 |
| 20-21 | 1,838 | 849 | 989 |
| 22-24 | 1,178 | 511 | 667 |
| 25-29 | 524 | 227 | 297 |
| 30-34 | 217 | 98 | 119 |
| 35-39 | 81 | 52 | 29 |
| 40-49 | 83 | 48 | 35 |
| 50-64 | 39 | 26 | 13 |
| Over 65 | 7 | 2 | 5 |
| Age | Total | Men | Women |
|---|
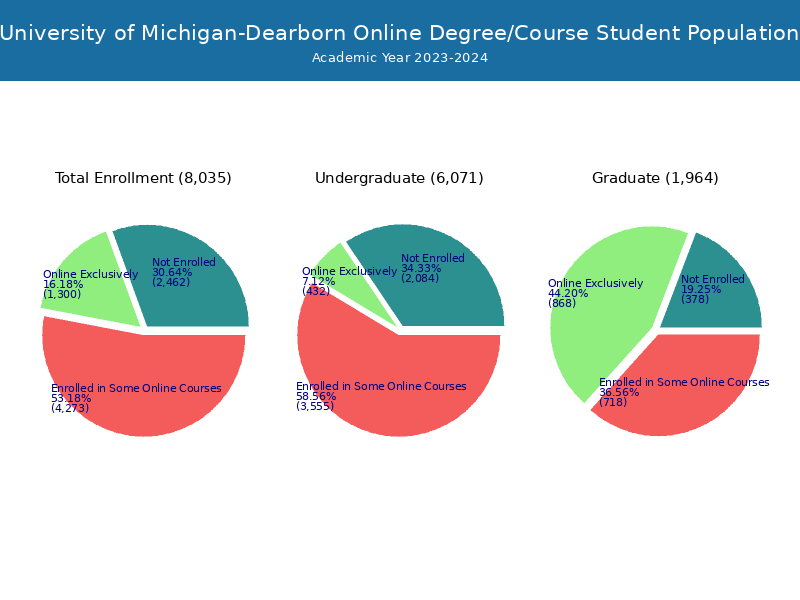
Online Student Enrollment
Distance learning, also called online education, is very attractive to students, especially who want to continue education and work in field. At University of Michigan-Dearborn, 1,348 students are enrolled exclusively in online courses and 4,280 students are enrolled in some online courses.
1,178 students lived in Michigan or jurisdiction in which the school is located are enrolled exclusively in online courses and 170 students live in other State or outside of the United States.
| All Students | Enrolled Exclusively Online Courses | Enrolled in Some Online Courses | |
|---|---|---|---|
| All Students | 8,223 | 1,348 | 4,280 |
| Undergraduate | 6,116 | 391 | 3,494 |
| Graduate | 2,107 | 957 | 786 |
| Michigan Residents | Other States in U.S. | Outside of U.S. | |
|---|---|---|---|
| All Students | 1,178 | 130 | 40 |
| Undergraduate | 375 | 13 | 3 |
| Graduate | 803 | 117 | 37 |
Transfer-in Students (Undergraduate)
Among 6,116 enrolled in undergraduate programs, 520 students have transferred-in from other institutions. The percentage of transfer-in students is 8.50%.370 students have transferred in as full-time status and 150 students transferred in as part-time status.
| Number of Students | |
|---|---|
| Regular Full-time | 4,297 |
| Transfer-in Full-time | 370 |
| Regular Part-time | 1,299 |
| Transfer-in Part-time | 150 |