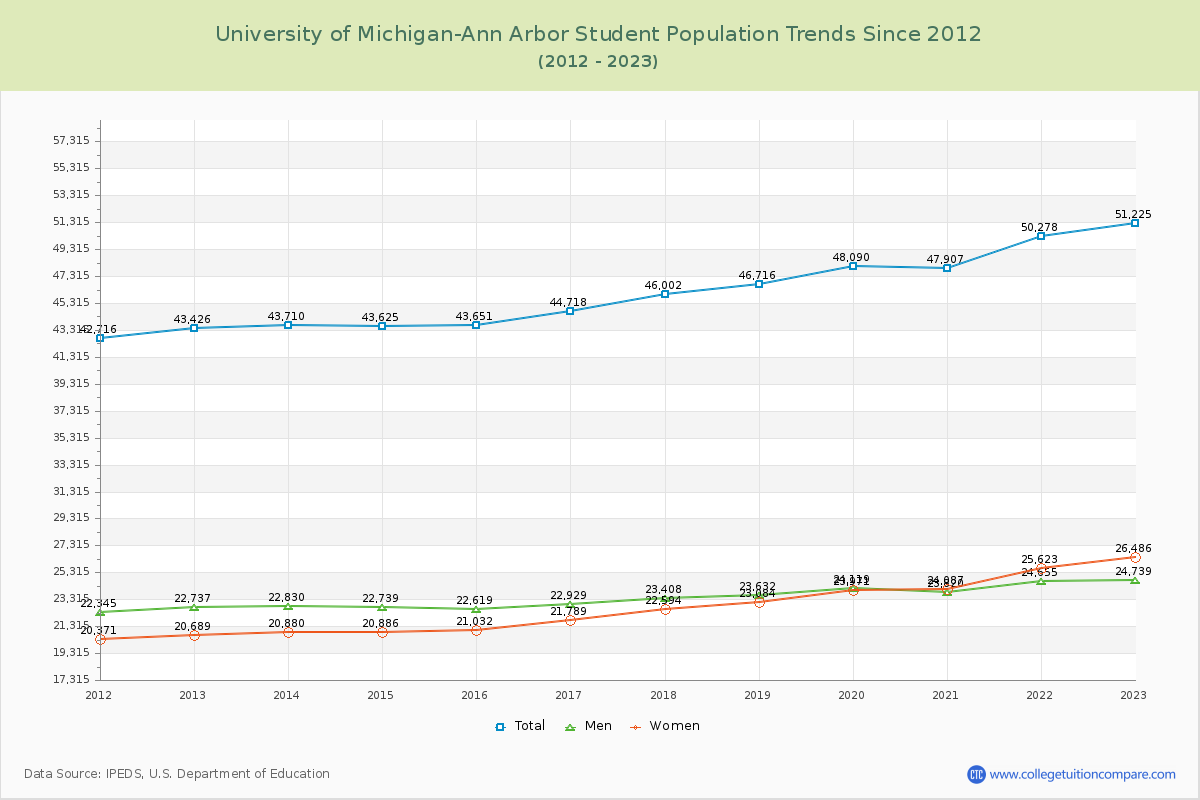
Student Population Changes
The average student population over the last 12 years is 46,304 where 51,225 students are attending the school for the academic year 2022-2023.
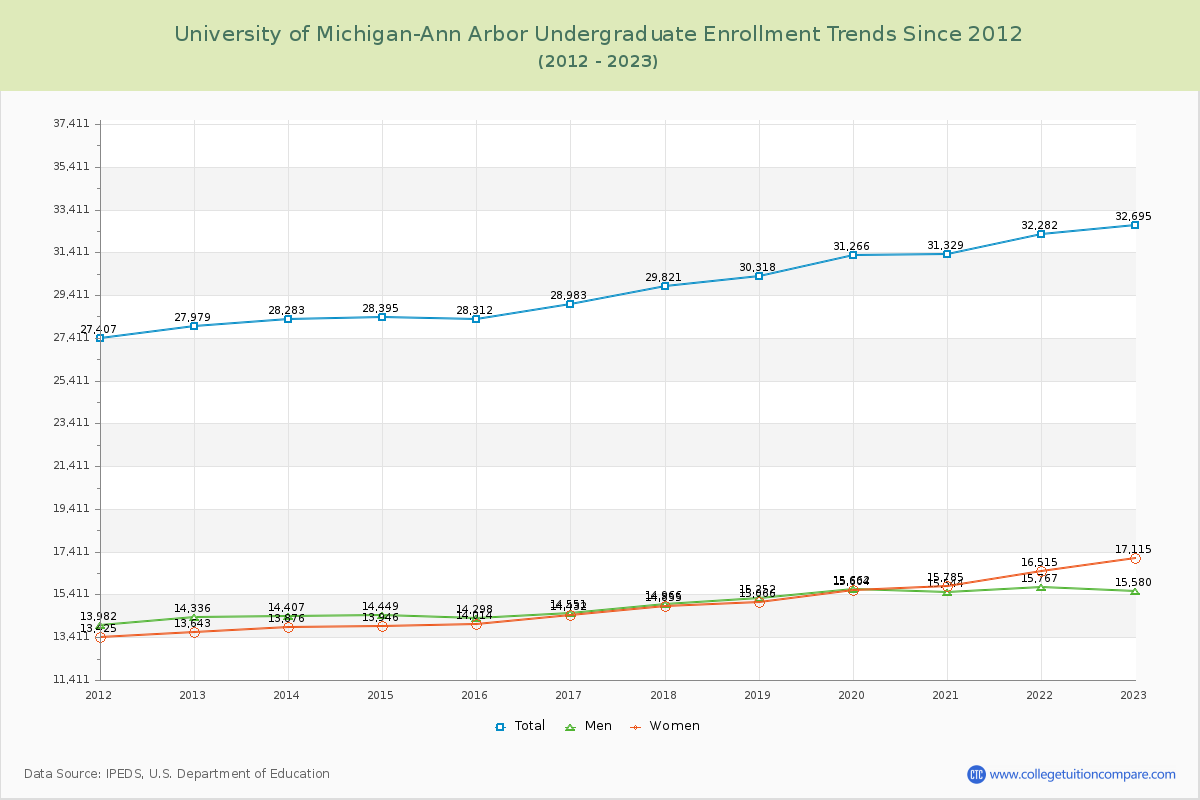
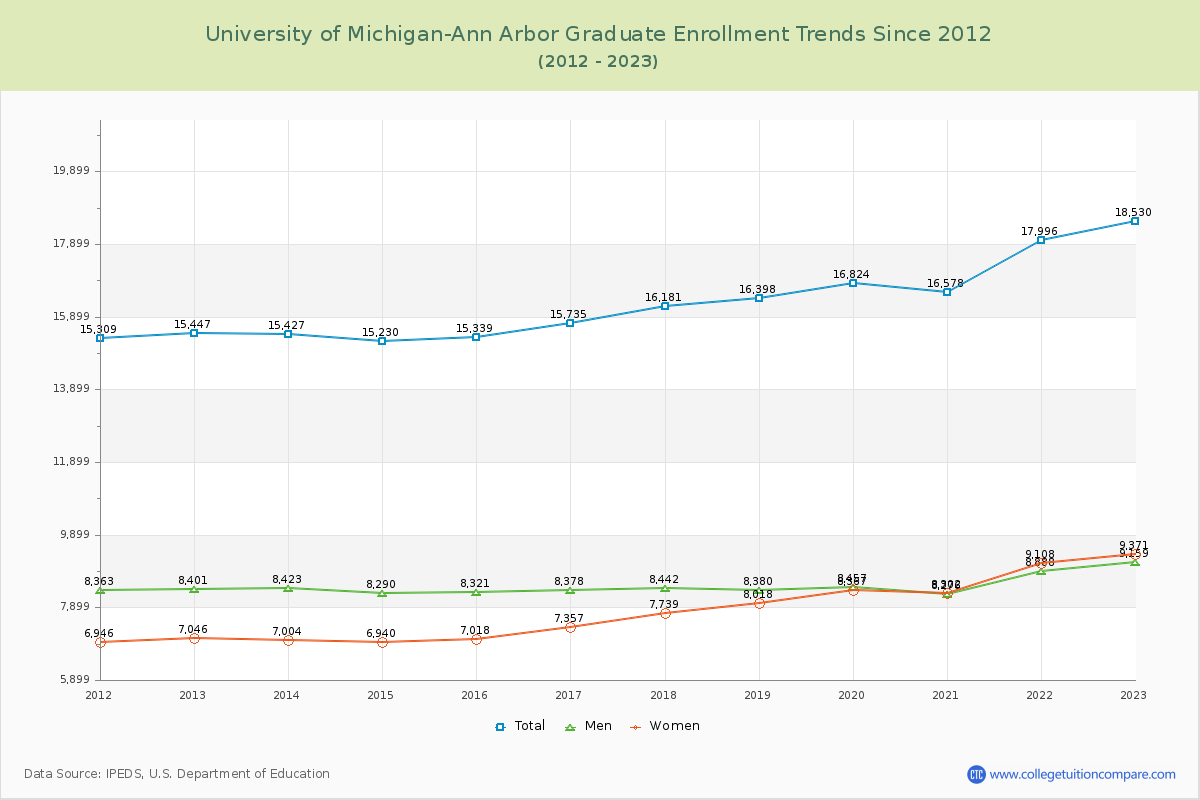
63.83% of total students is undergraduate students and 36.17% students is graduate students. The number of undergraduate students has increased by 4,716 and the graduate enrollment has increased by 3,083 over past 10 years.
The female to male ratio is 1.07 to 1 and it means that there are similar numbers of female and male students enrolled in UM-Ann Arbor.
The following table and chart illustrate the changes in student population by gender at University of Michigan-Ann Arbor since 2012.
| Year | Total | Undergraduate | Graduate | ||||
|---|---|---|---|---|---|---|---|
| Total | Men | Women | Total | Men | Women | ||
| 2012-13 | 43,426 | 27,979 | 14,336 | 13,643 | 15,447 | 8,401 | 7,046 |
| 2013-14 | 43,710 284 | 28,283 304 | 14,407 71 | 13,876 233 | 15,427 -20 | 8,423 22 | 7,004 -42 |
| 2014-15 | 43,625 -85 | 28,395 112 | 14,449 42 | 13,946 70 | 15,230 -197 | 8,290 -133 | 6,940 -64 |
| 2015-16 | 43,651 26 | 28,312 -83 | 14,298 -151 | 14,014 68 | 15,339 109 | 8,321 31 | 7,018 78 |
| 2016-17 | 44,718 1,067 | 28,983 671 | 14,551 253 | 14,432 418 | 15,735 396 | 8,378 57 | 7,357 339 |
| 2017-18 | 46,002 1,284 | 29,821 838 | 14,966 415 | 14,855 423 | 16,181 446 | 8,442 64 | 7,739 382 |
| 2018-19 | 46,716 714 | 30,318 497 | 15,252 286 | 15,066 211 | 16,398 217 | 8,380 -62 | 8,018 279 |
| 2019-20 | 48,090 1,374 | 31,266 948 | 15,662 410 | 15,604 538 | 16,824 426 | 8,457 77 | 8,367 349 |
| 2020-21 | 47,907 -183 | 31,329 63 | 15,544 -118 | 15,785 181 | 16,578 -246 | 8,276 -181 | 8,302 -65 |
| 2021-22 | 50,278 2,371 | 32,282 953 | 15,767 223 | 16,515 730 | 17,996 1,418 | 8,888 612 | 9,108 806 |
| 2022-23 | 51,225 947 | 32,695 413 | 15,580 -187 | 17,115 600 | 18,530 534 | 9,159 271 | 9,371 263 |
| Average | 46,304 | 29,969 | 14,983 | 14,986 | 16,335 | 8,492 | 7,843 |