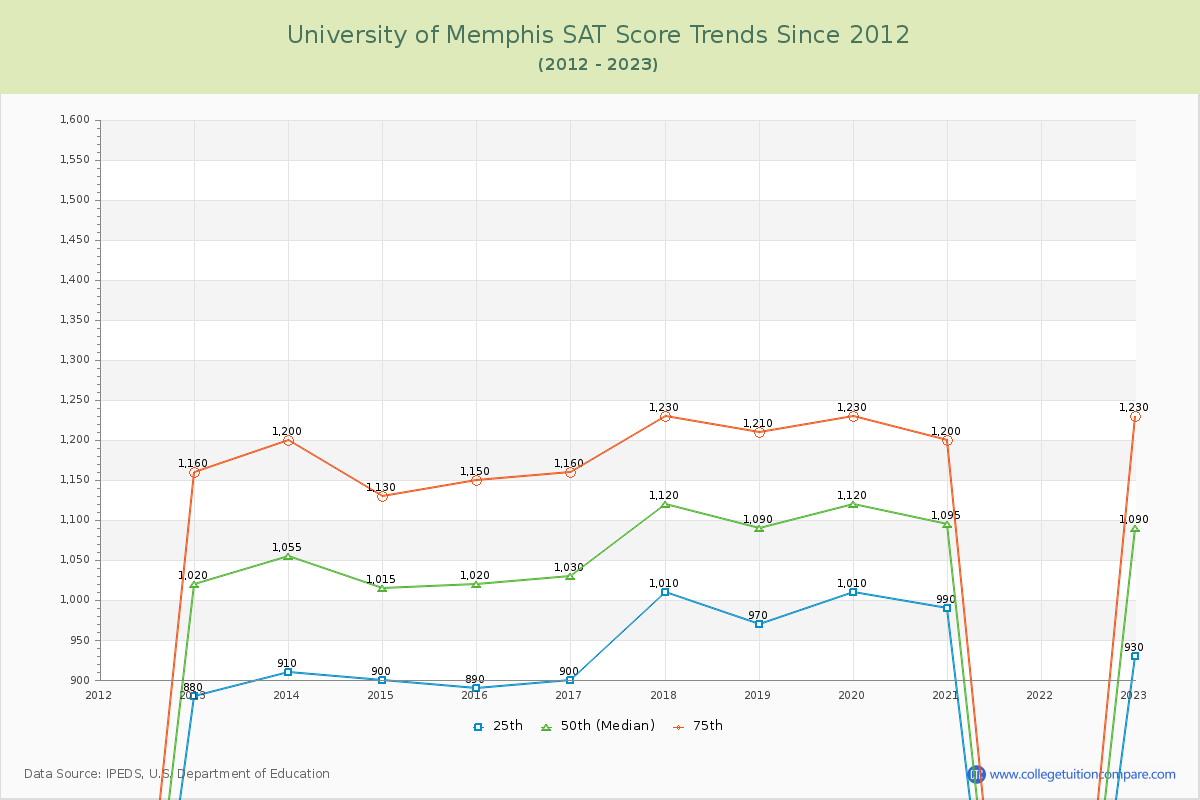
SAT Scores Over Time
The 2023 SAT score is 1090 at U of Memphis. Over the past 12 years, the average SAT score is 939 (25th percentile) and 1190 (75th percentile). Compared to similar schools, the submitted SAT scores are around national average at U of Memphis.
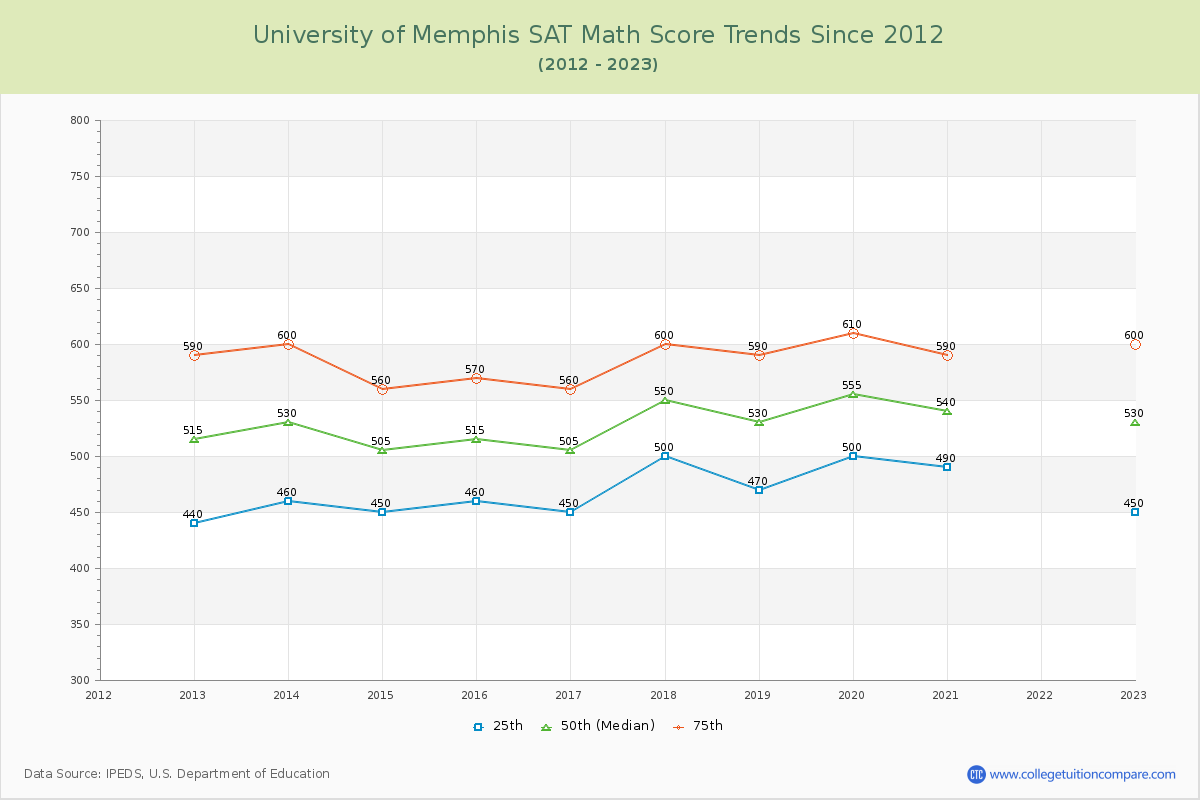
The following table and chart illustrate the changes in SAT scores at University of Memphis since 2012.
| Year | Total | Math | Evidence-Based Reading and Writing | ||||||
|---|---|---|---|---|---|---|---|---|---|
| 25th | 50th | 75th | 25th | 50th | 75th | 25th | 50th | 75th | |
| 2012-13 | 880 | 1,020 | 1,160 | 440 | 515 | 590 | 440 | 505 | 570 |
| 2013-14 | 910 | 1,055 | 1,200 | 460 | 530 | 600 | 450 | 525 | 600 |
| 2014-15 | 900 | 1,015 | 1,130 | 450 | 505 | 560 | 450 | 510 | 570 |
| 2015-16 | 890 | 1,020 | 1,150 | 460 | 515 | 570 | 430 | 505 | 580 |
| 2016-17 | 900 | 1,030 | 1,160 | 450 | 505 | 560 | 450 | 525 | 600 |
| 2017-18 | 1,010 | 1,120 | 1,230 | 500 | 550 | 600 | 510 | 570 | 630 |
| 2018-19 | 970 | 1,090 | 1,210 | 470 | 530 | 590 | 500 | 560 | 620 |
| 2019-20 | 1,010 | 1,120 | 1,230 | 500 | 555 | 610 | 510 | 565 | 620 |
| 2020-21 | 990 | 1,095 | 1,200 | 490 | 540 | 590 | 500 | 555 | 610 |
| 2021-22 | - | - | - | - | - | - | - | - | - |
| 2022-23 | 930 | 1,090 | 1,230 | 450 | 530 | 600 | 480 | 560 | 630 |
| Average | 939 | 1066 | 1190 | 467 | 528 | 587 | 472 | 538 | 603 |
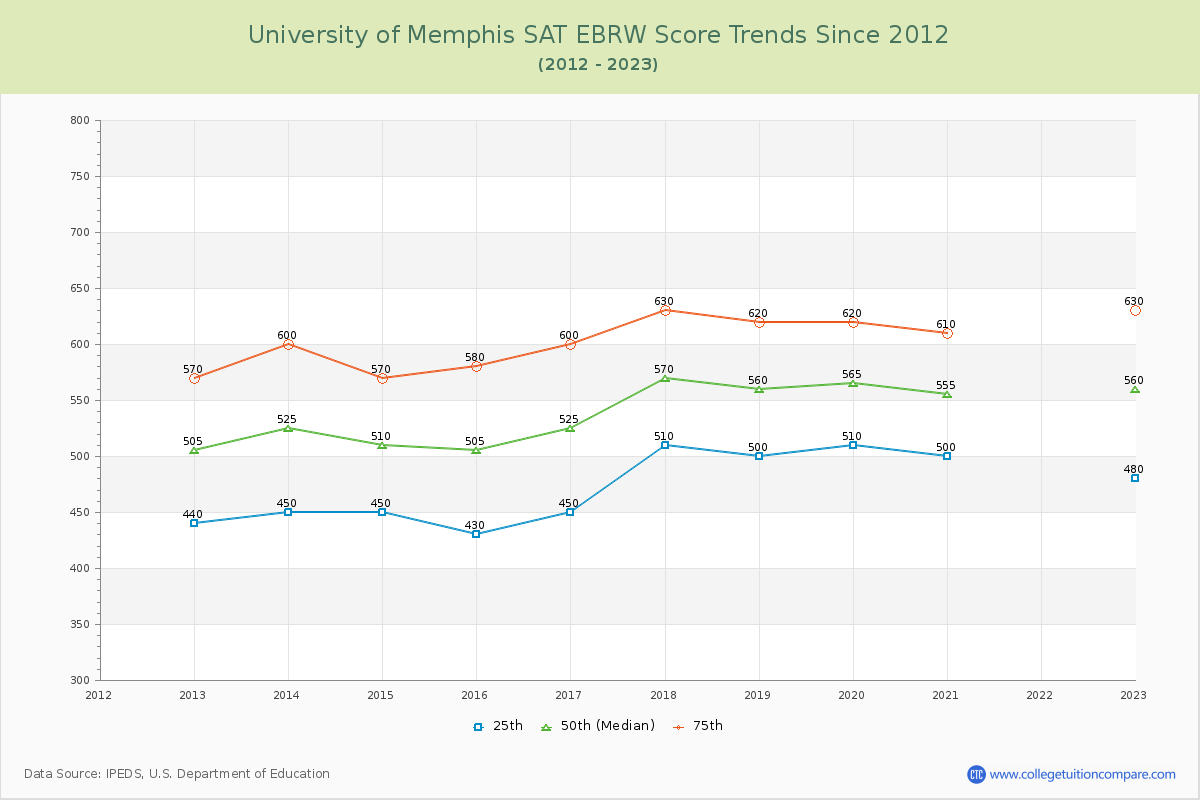
*SAT Evidence-Based Reading and Writing replaces SAT critical reading and writing since year 2017.
**The SAT Writing score is excluded from the total scores for year from 2011 to 2016.