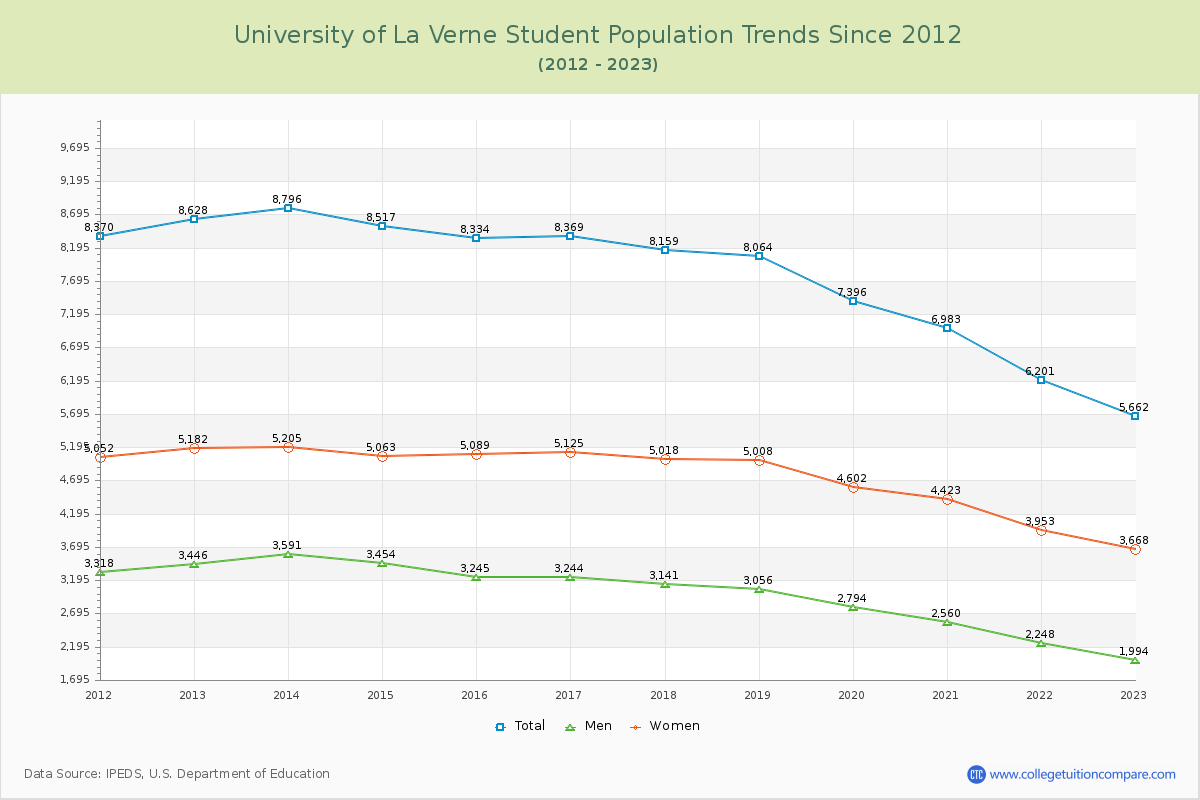
Student Population Changes
The average student population over the last 12 years is 7,737 where 5,662 students are attending the school for the academic year 2022-2023.
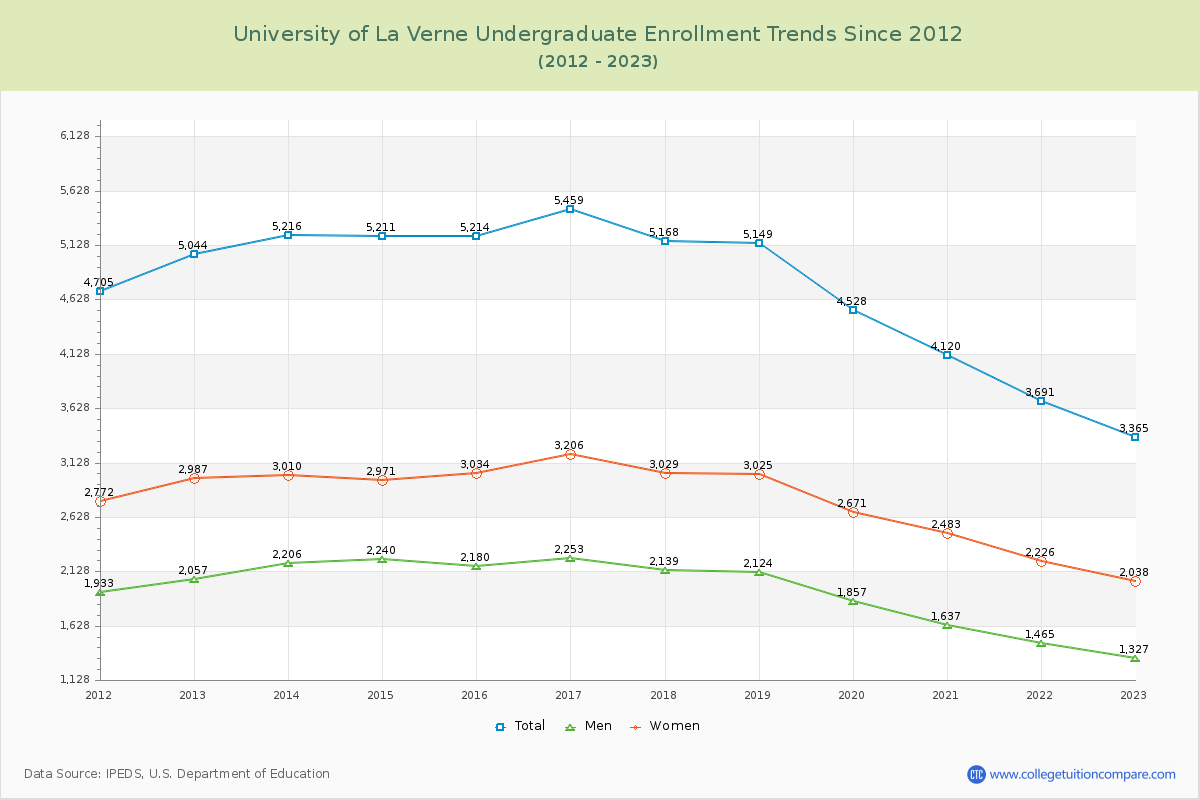
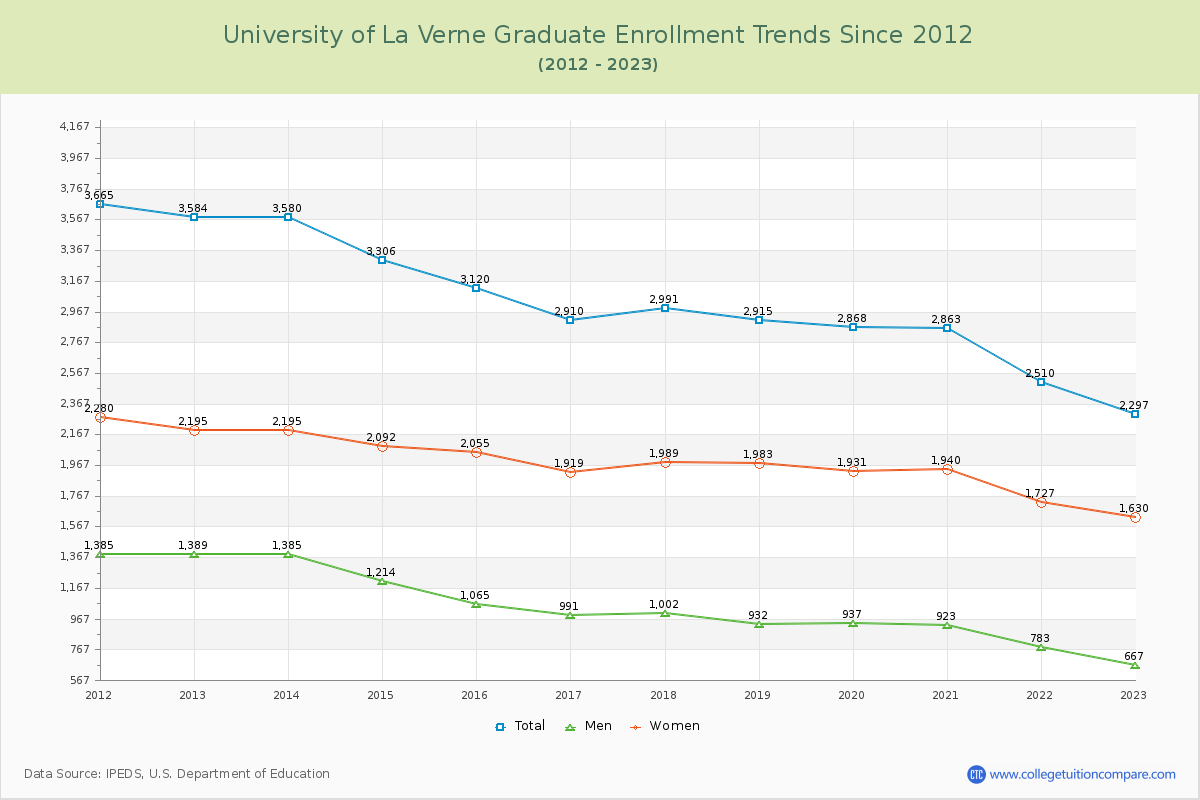
59.43% of total students is undergraduate students and 40.57% students is graduate students. The number of undergraduate students has decreased by 1,679 and the graduate enrollment has decreased by 1,287 over past 10 years.
The female to male ratio is 1.84 to 1 and it means that there are more female students enrolled in La Verne than male students.
The following table and chart illustrate the changes in student population by gender at University of La Verne since 2012.
| Year | Total | Undergraduate | Graduate | ||||
|---|---|---|---|---|---|---|---|
| Total | Men | Women | Total | Men | Women | ||
| 2012-13 | 8,628 | 5,044 | 2,057 | 2,987 | 3,584 | 1,389 | 2,195 |
| 2013-14 | 8,796 168 | 5,216 172 | 2,206 149 | 3,010 23 | 3,580 -4 | 1,385 -4 | 2,195 0 |
| 2014-15 | 8,517 -279 | 5,211 -5 | 2,240 34 | 2,971 -39 | 3,306 -274 | 1,214 -171 | 2,092 -103 |
| 2015-16 | 8,334 -183 | 5,214 3 | 2,180 -60 | 3,034 63 | 3,120 -186 | 1,065 -149 | 2,055 -37 |
| 2016-17 | 8,369 35 | 5,459 245 | 2,253 73 | 3,206 172 | 2,910 -210 | 991 -74 | 1,919 -136 |
| 2017-18 | 8,159 -210 | 5,168 -291 | 2,139 -114 | 3,029 -177 | 2,991 81 | 1,002 11 | 1,989 70 |
| 2018-19 | 8,064 -95 | 5,149 -19 | 2,124 -15 | 3,025 -4 | 2,915 -76 | 932 -70 | 1,983 -6 |
| 2019-20 | 7,396 -668 | 4,528 -621 | 1,857 -267 | 2,671 -354 | 2,868 -47 | 937 5 | 1,931 -52 |
| 2020-21 | 6,983 -413 | 4,120 -408 | 1,637 -220 | 2,483 -188 | 2,863 -5 | 923 -14 | 1,940 9 |
| 2021-22 | 6,201 -782 | 3,691 -429 | 1,465 -172 | 2,226 -257 | 2,510 -353 | 783 -140 | 1,727 -213 |
| 2022-23 | 5,662 -539 | 3,365 -326 | 1,327 -138 | 2,038 -188 | 2,297 -213 | 667 -116 | 1,630 -97 |
| Average | 7,737 | 4,742 | 1,953 | 2,789 | 2,995 | 1,026 | 1,969 |