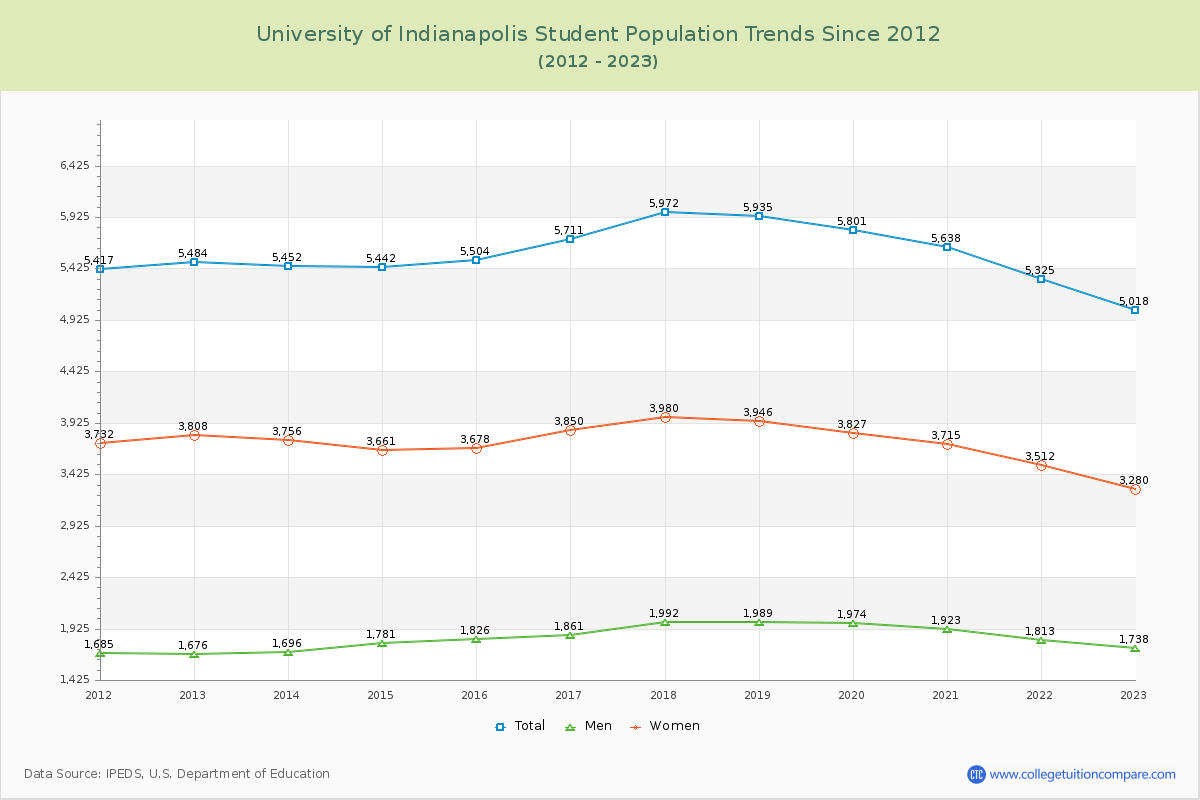
Student Population Changes
The average student population over the last 12 years is 5,571 where 5,018 students are attending the school for the academic year 2022-2023.
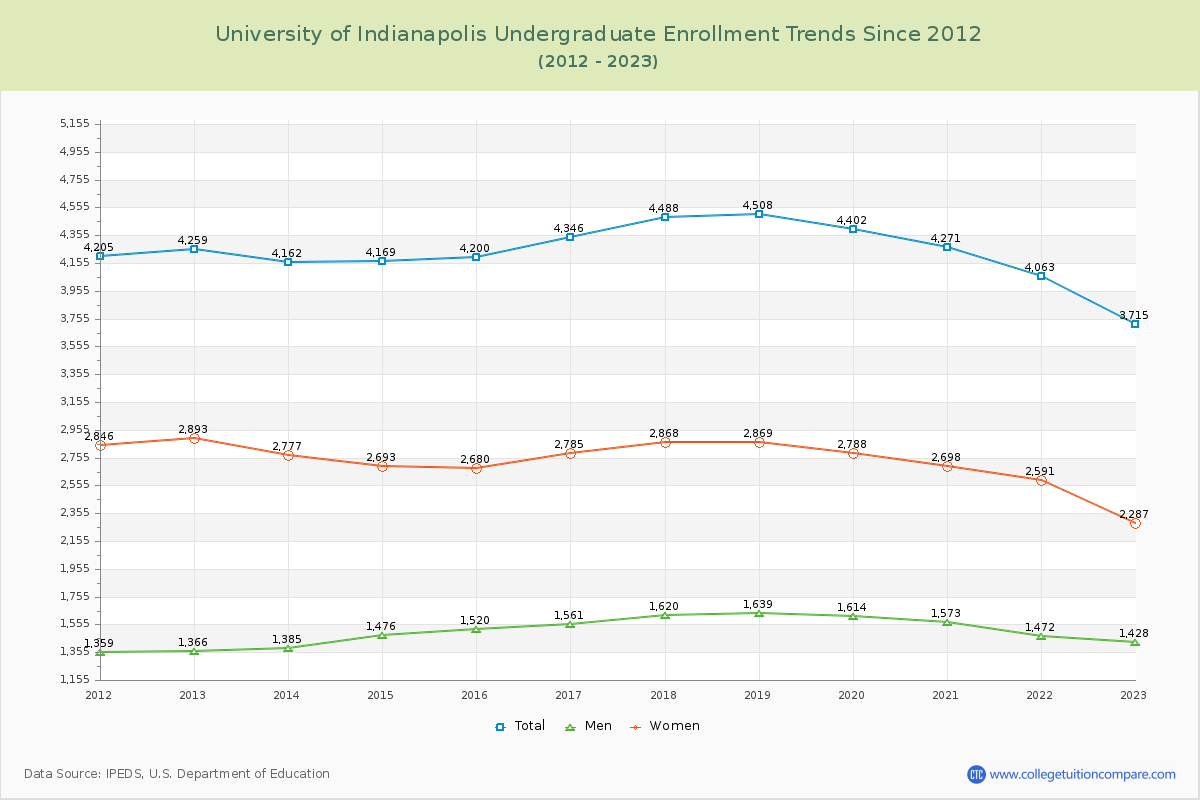
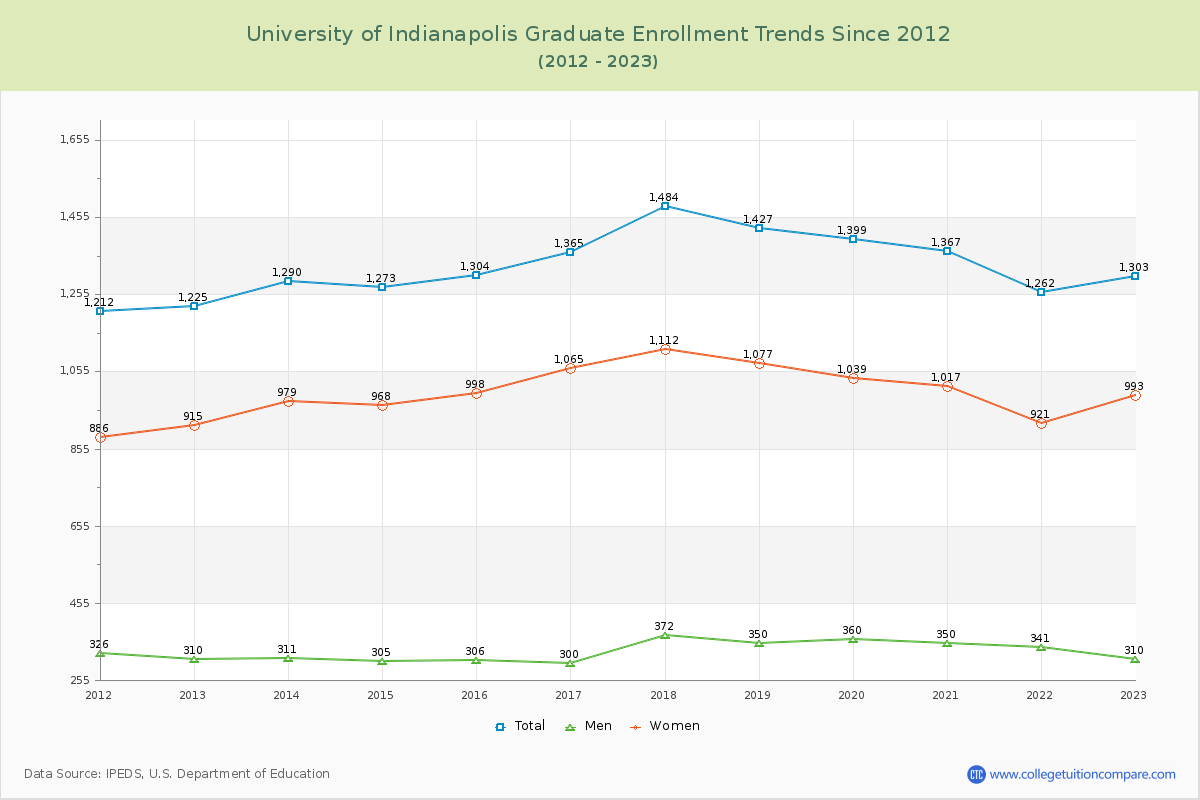
74.03% of total students is undergraduate students and 25.97% students is graduate students. The number of undergraduate students has decreased by 544 and the graduate enrollment has increased by 78 over past 10 years.
The female to male ratio is 1.89 to 1 and it means that there are more female students enrolled in UIndy than male students.
The following table and chart illustrate the changes in student population by gender at University of Indianapolis since 2012.
| Year | Total | Undergraduate | Graduate | ||||
|---|---|---|---|---|---|---|---|
| Total | Men | Women | Total | Men | Women | ||
| 2012-13 | 5,484 | 4,259 | 1,366 | 2,893 | 1,225 | 310 | 915 |
| 2013-14 | 5,452 -32 | 4,162 -97 | 1,385 19 | 2,777 -116 | 1,290 65 | 311 1 | 979 64 |
| 2014-15 | 5,442 -10 | 4,169 7 | 1,476 91 | 2,693 -84 | 1,273 -17 | 305 -6 | 968 -11 |
| 2015-16 | 5,504 62 | 4,200 31 | 1,520 44 | 2,680 -13 | 1,304 31 | 306 1 | 998 30 |
| 2016-17 | 5,711 207 | 4,346 146 | 1,561 41 | 2,785 105 | 1,365 61 | 300 -6 | 1,065 67 |
| 2017-18 | 5,972 261 | 4,488 142 | 1,620 59 | 2,868 83 | 1,484 119 | 372 72 | 1,112 47 |
| 2018-19 | 5,935 -37 | 4,508 20 | 1,639 19 | 2,869 1 | 1,427 -57 | 350 -22 | 1,077 -35 |
| 2019-20 | 5,801 -134 | 4,402 -106 | 1,614 -25 | 2,788 -81 | 1,399 -28 | 360 10 | 1,039 -38 |
| 2020-21 | 5,638 -163 | 4,271 -131 | 1,573 -41 | 2,698 -90 | 1,367 -32 | 350 -10 | 1,017 -22 |
| 2021-22 | 5,325 -313 | 4,063 -208 | 1,472 -101 | 2,591 -107 | 1,262 -105 | 341 -9 | 921 -96 |
| 2022-23 | 5,018 -307 | 3,715 -348 | 1,428 -44 | 2,287 -304 | 1,303 41 | 310 -31 | 993 72 |
| Average | 5,571 | 4,235 | 1,514 | 2,721 | 1,336 | 329 | 1,008 |