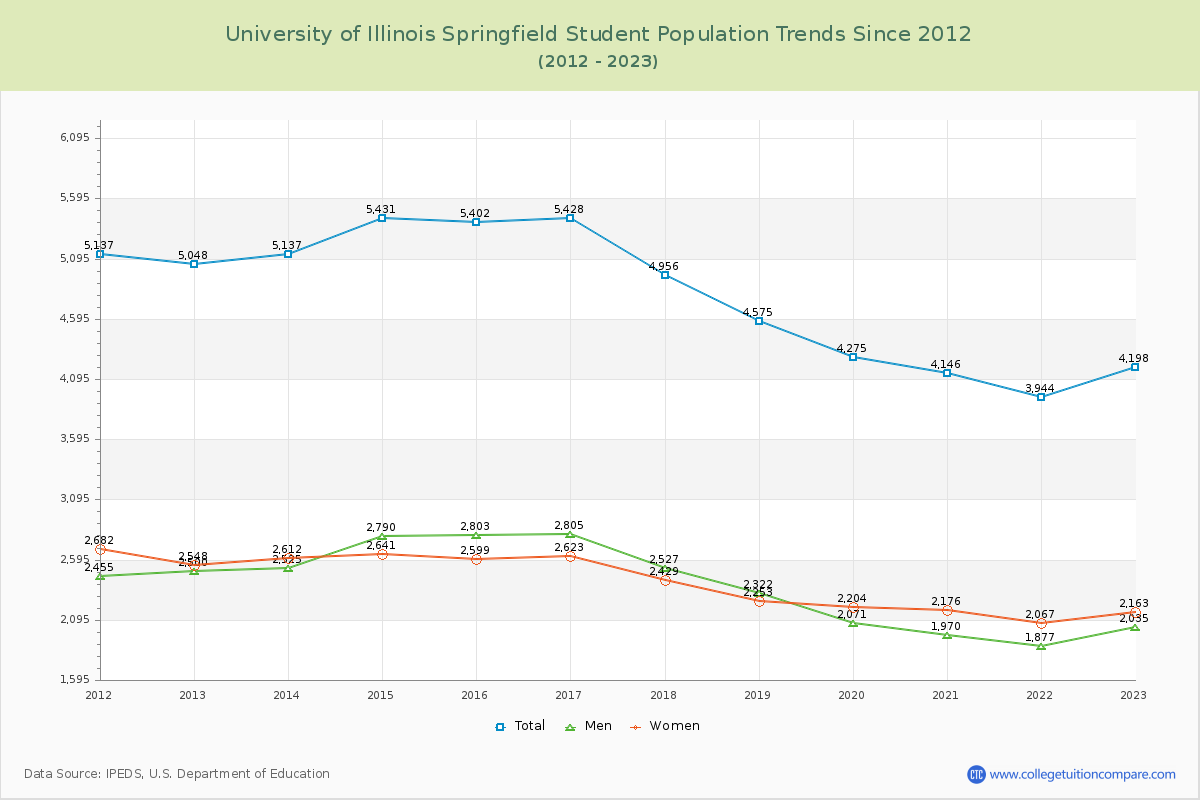
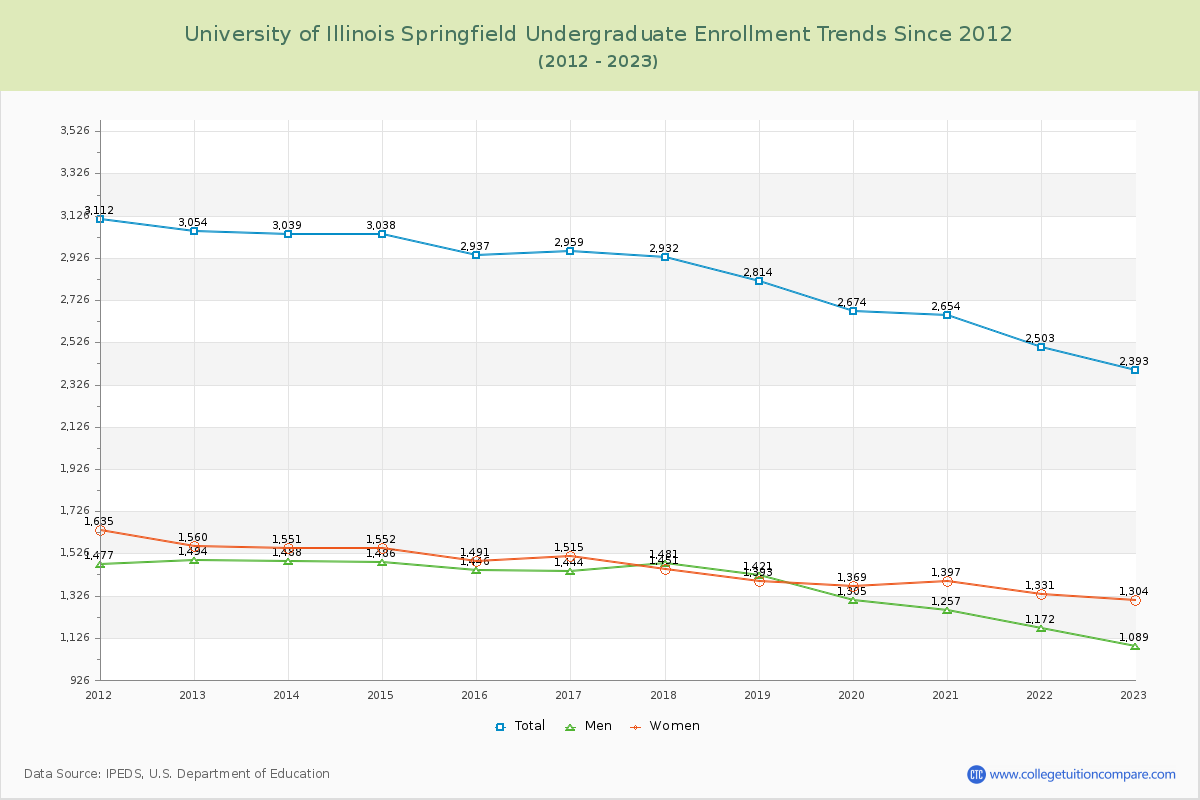
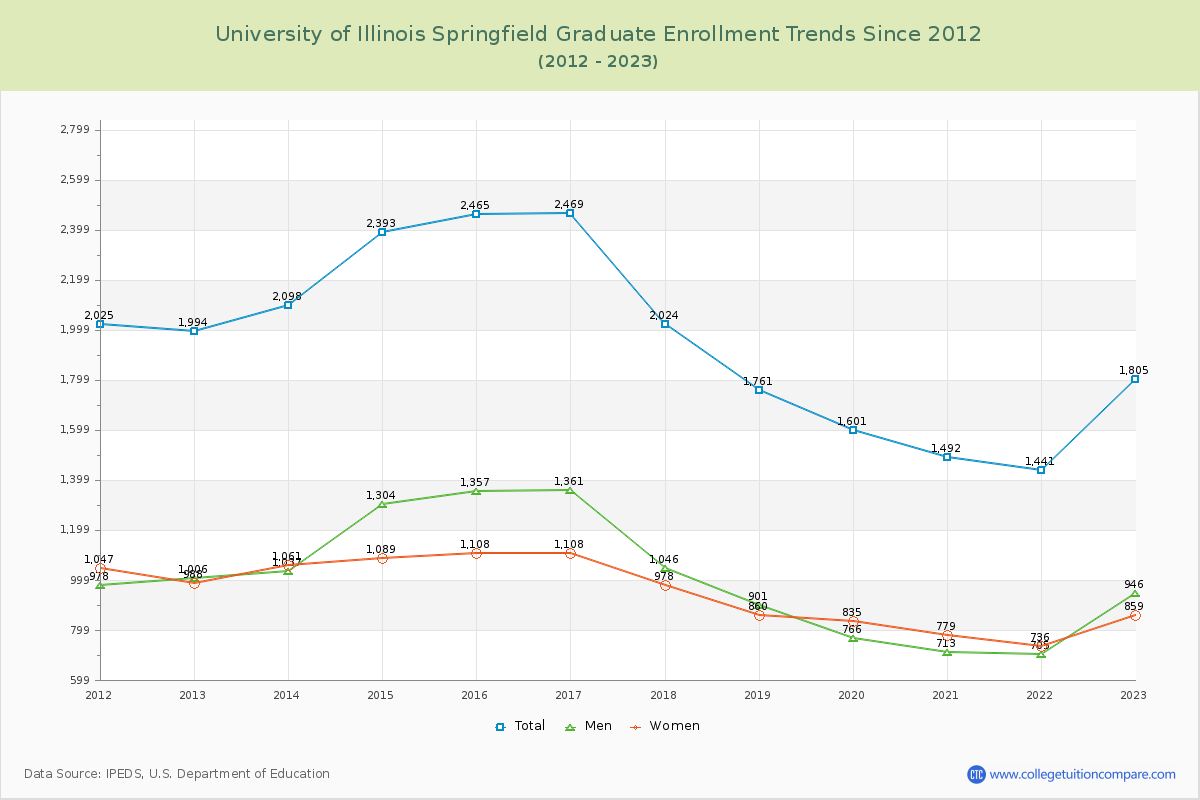
Student Population Changes
The average student population over the last 12 years is 4,776 where 4,198 students are attending the school for the academic year 2022-2023.
57.00% of total students is undergraduate students and 43.00% students is graduate students. The number of undergraduate students has decreased by 661 and the graduate enrollment has decreased by 189 over past 10 years.
The female to male ratio is 1.06 to 1 and it means that there are similar numbers of female and male students enrolled in UIS.
The following table and chart illustrate the changes in student population by gender at University of Illinois Springfield since 2012.
| Year | Total | Undergraduate | Graduate | ||||
|---|---|---|---|---|---|---|---|
| Total | Men | Women | Total | Men | Women | ||
| 2012-13 | 5,048 | 3,054 | 1,494 | 1,560 | 1,994 | 1,006 | 988 |
| 2013-14 | 5,137 89 | 3,039 -15 | 1,488 -6 | 1,551 -9 | 2,098 104 | 1,037 31 | 1,061 73 |
| 2014-15 | 5,431 294 | 3,038 -1 | 1,486 -2 | 1,552 1 | 2,393 295 | 1,304 267 | 1,089 28 |
| 2015-16 | 5,402 -29 | 2,937 -101 | 1,446 -40 | 1,491 -61 | 2,465 72 | 1,357 53 | 1,108 19 |
| 2016-17 | 5,428 26 | 2,959 22 | 1,444 -2 | 1,515 24 | 2,469 4 | 1,361 4 | 1,108 0 |
| 2017-18 | 4,956 -472 | 2,932 -27 | 1,481 37 | 1,451 -64 | 2,024 -445 | 1,046 -315 | 978 -130 |
| 2018-19 | 4,575 -381 | 2,814 -118 | 1,421 -60 | 1,393 -58 | 1,761 -263 | 901 -145 | 860 -118 |
| 2019-20 | 4,275 -300 | 2,674 -140 | 1,305 -116 | 1,369 -24 | 1,601 -160 | 766 -135 | 835 -25 |
| 2020-21 | 4,146 -129 | 2,654 -20 | 1,257 -48 | 1,397 28 | 1,492 -109 | 713 -53 | 779 -56 |
| 2021-22 | 3,944 -202 | 2,503 -151 | 1,172 -85 | 1,331 -66 | 1,441 -51 | 705 -8 | 736 -43 |
| 2022-23 | 4,198 254 | 2,393 -110 | 1,089 -83 | 1,304 -27 | 1,805 364 | 946 241 | 859 123 |
| Average | 4,776 | 2,818 | 1,371 | 1,447 | 1,958 | 1,013 | 946 |