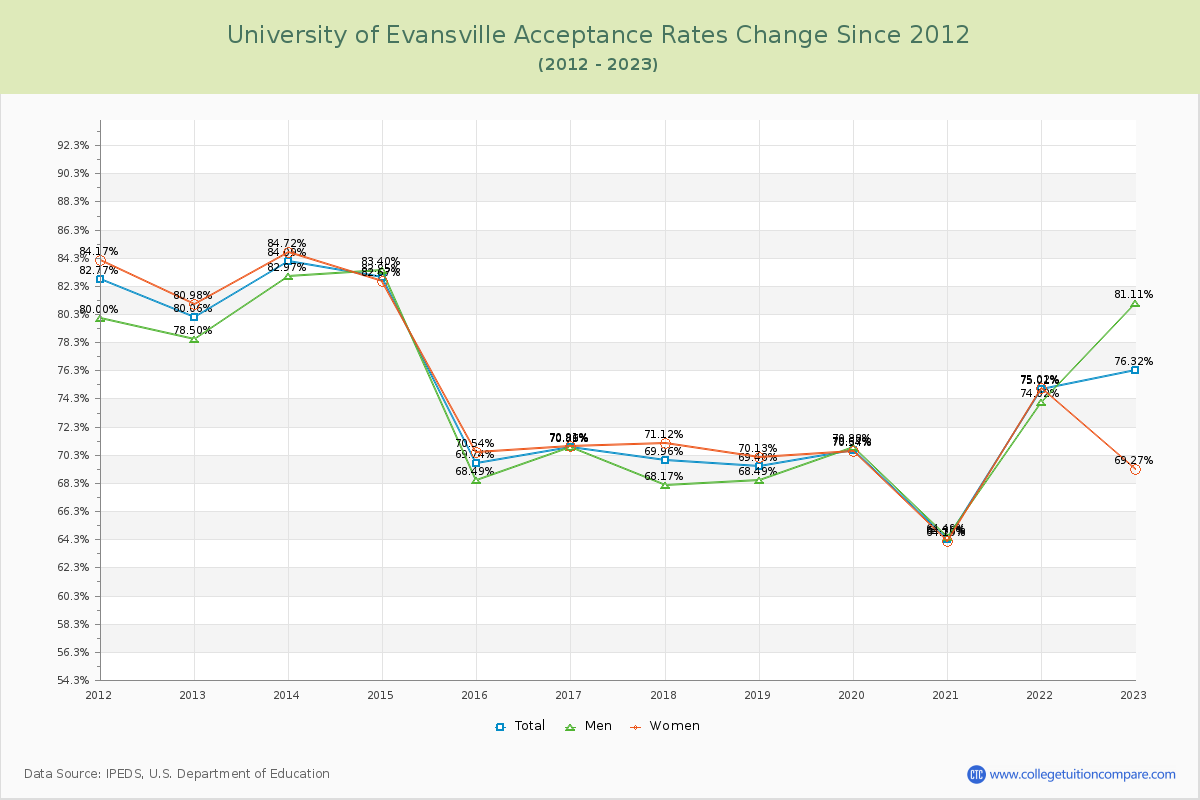
Acceptance Rate Changes
The average acceptance rate over the last 10 years is 73.95%, and this year's acceptance rate is 76.32% at University of Evansville. By gender, men students' acceptance rate is 73.76% and women students' rate is 73.65%.
The next table and chart illustrate the acceptance rates changes at University of Evansville over the past 11 years (2012-2023).
| Year | Total | Men | Women |
|---|---|---|---|
| 2012-13 | 80.06% | 78.50% | 80.98% |
| 2013-14 | 84.09% 4.03% |
82.97% 3.74% |
84.72% 3.74% |
| 2014-15 | 82.95% -1.14% |
83.40% -2.05% |
82.67% -2.05% |
| 2015-16 | 69.74% -13.21% |
68.49% -12.13% |
70.54% -12.13% |
| 2016-17 | 70.89% 1.15% |
70.86% 0.37% |
70.91% 0.37% |
| 2017-18 | 69.96% -0.93% |
68.17% 0.21% |
71.12% 0.21% |
| 2018-19 | 69.48% -0.48% |
68.49% -0.99% |
70.13% -0.99% |
| 2019-20 | 70.67% 1.19% |
70.88% 0.41% |
70.54% 0.41% |
| 2020-21 | 64.30% -6.36% |
64.49% -6.35% |
64.19% -6.35% |
| 2021-22 | 75.01% 10.70% |
74.02% 10.83% |
75.02% 10.83% |
| 2022-23 | 76.32% 1.32% |
81.11% -5.75% |
69.27% -5.75% |
| Average | 73.95% | 73.76% | 73.65% |