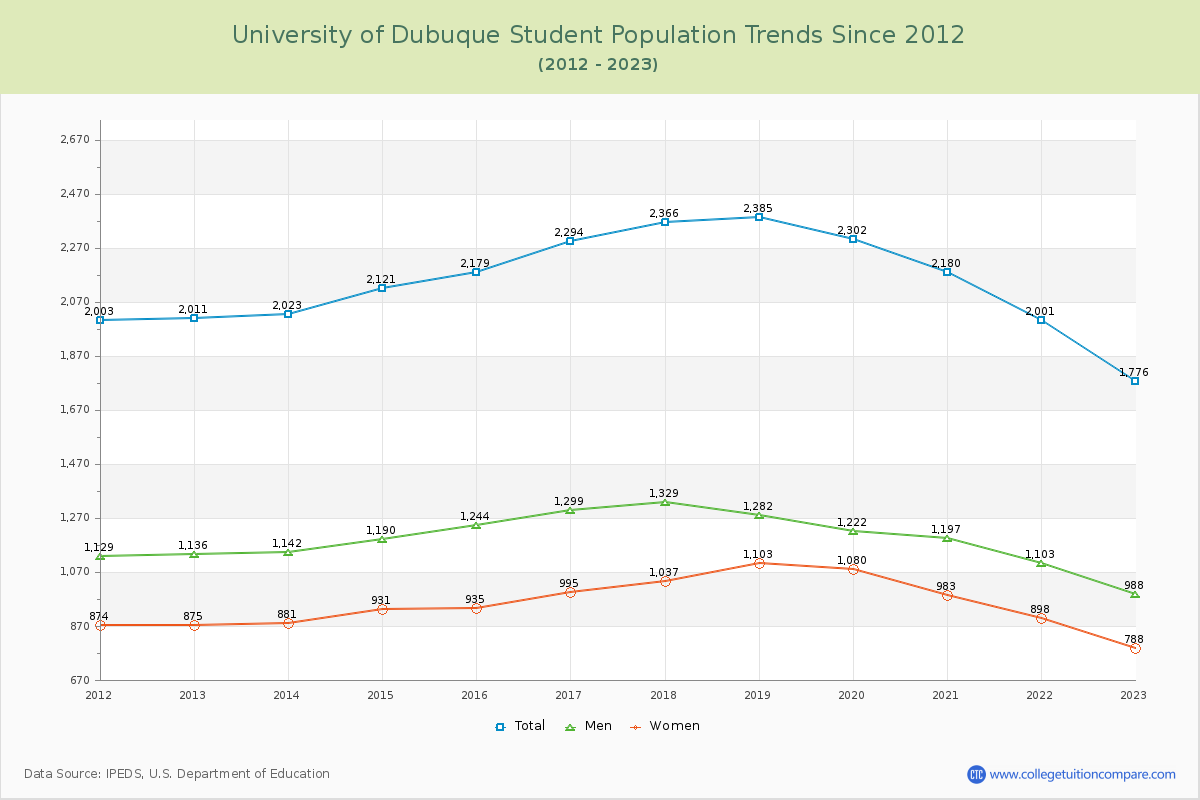
Student Population Changes
The average student population over the last 12 years is 2,149 where 1,776 students are attending the school for the academic year 2022-2023.
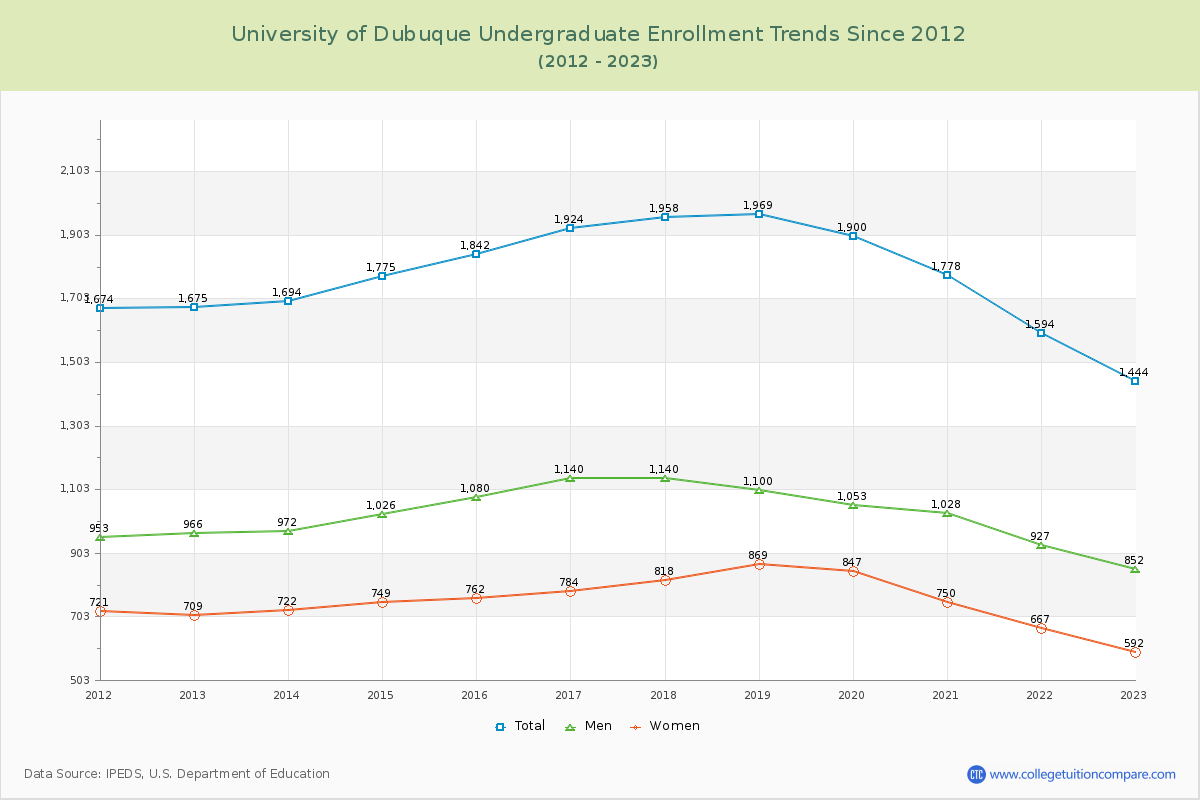
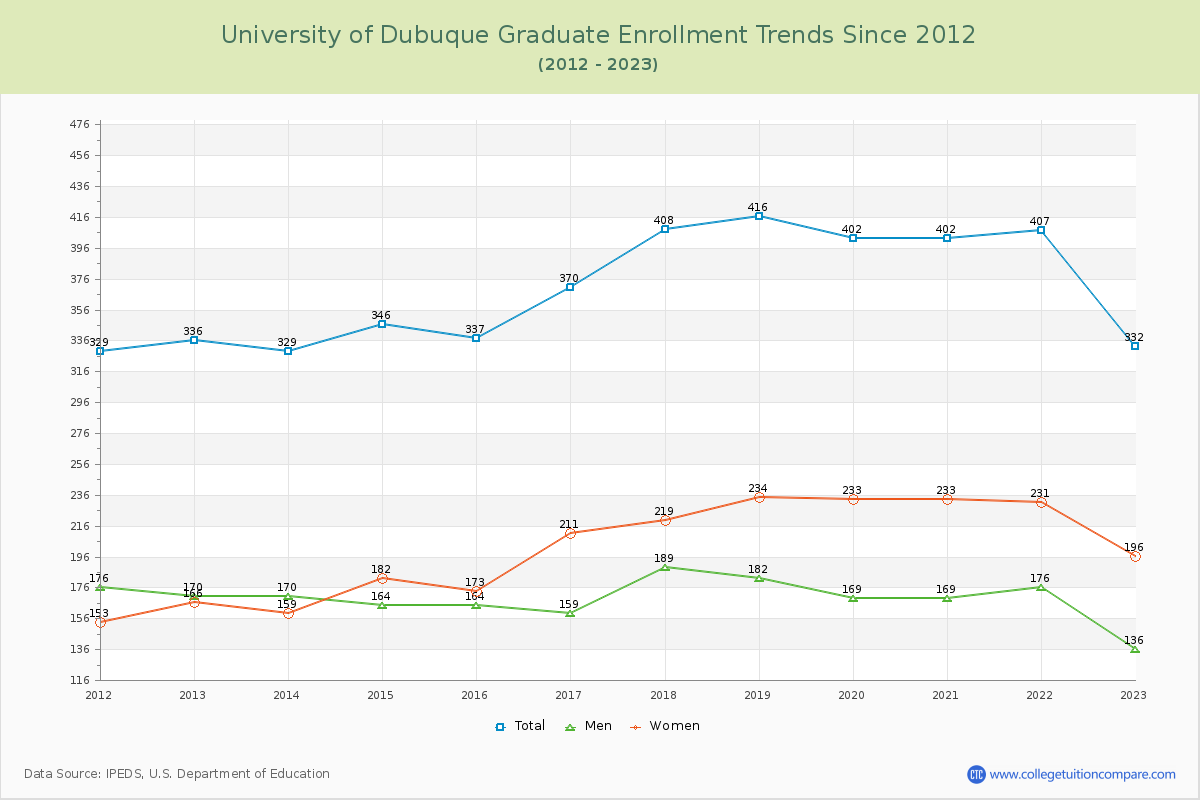
81.31% of total students is undergraduate students and 18.69% students is graduate students. The number of undergraduate students has decreased by 231 and the graduate enrollment has decreased by 4 over past 10 years.
The female to male ratio is 0.80 to 1 and it means that there are more male students enrolled in U of Dubuque than female students.
The following table and chart illustrate the changes in student population by gender at University of Dubuque since 2012.
| Year | Total | Undergraduate | Graduate | ||||
|---|---|---|---|---|---|---|---|
| Total | Men | Women | Total | Men | Women | ||
| 2012-13 | 2,011 | 1,675 | 966 | 709 | 336 | 170 | 166 |
| 2013-14 | 2,023 12 | 1,694 19 | 972 6 | 722 13 | 329 -7 | 170 0 | 159 -7 |
| 2014-15 | 2,121 98 | 1,775 81 | 1,026 54 | 749 27 | 346 17 | 164 -6 | 182 23 |
| 2015-16 | 2,179 58 | 1,842 67 | 1,080 54 | 762 13 | 337 -9 | 164 0 | 173 -9 |
| 2016-17 | 2,294 115 | 1,924 82 | 1,140 60 | 784 22 | 370 33 | 159 -5 | 211 38 |
| 2017-18 | 2,366 72 | 1,958 34 | 1,140 0 | 818 34 | 408 38 | 189 30 | 219 8 |
| 2018-19 | 2,385 19 | 1,969 11 | 1,100 -40 | 869 51 | 416 8 | 182 -7 | 234 15 |
| 2019-20 | 2,302 -83 | 1,900 -69 | 1,053 -47 | 847 -22 | 402 -14 | 169 -13 | 233 -1 |
| 2020-21 | 2,180 -122 | 1,778 -122 | 1,028 -25 | 750 -97 | 402 0 | 169 0 | 233 0 |
| 2021-22 | 2,001 -179 | 1,594 -184 | 927 -101 | 667 -83 | 407 5 | 176 7 | 231 -2 |
| 2022-23 | 1,776 -225 | 1,444 -150 | 852 -75 | 592 -75 | 332 -75 | 136 -40 | 196 -35 |
| Average | 2,149 | 1,778 | 1,026 | 752 | 371 | 168 | 203 |