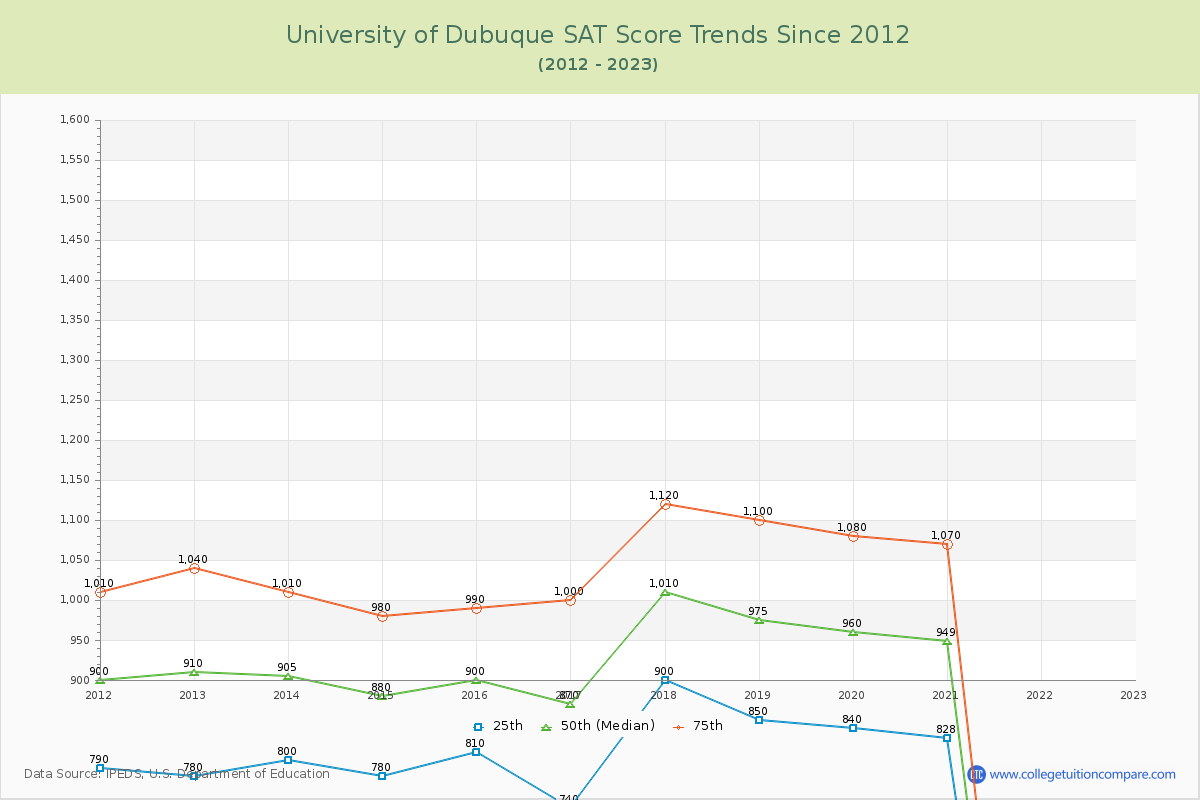
SAT Scores Over Time
The 2023 SAT score is at U of Dubuque. Over the past 12 years, the average SAT score is 814 (25th percentile) and 1043 (75th percentile). Compared to similar schools, the submitted SAT scores are around national average at U of Dubuque.
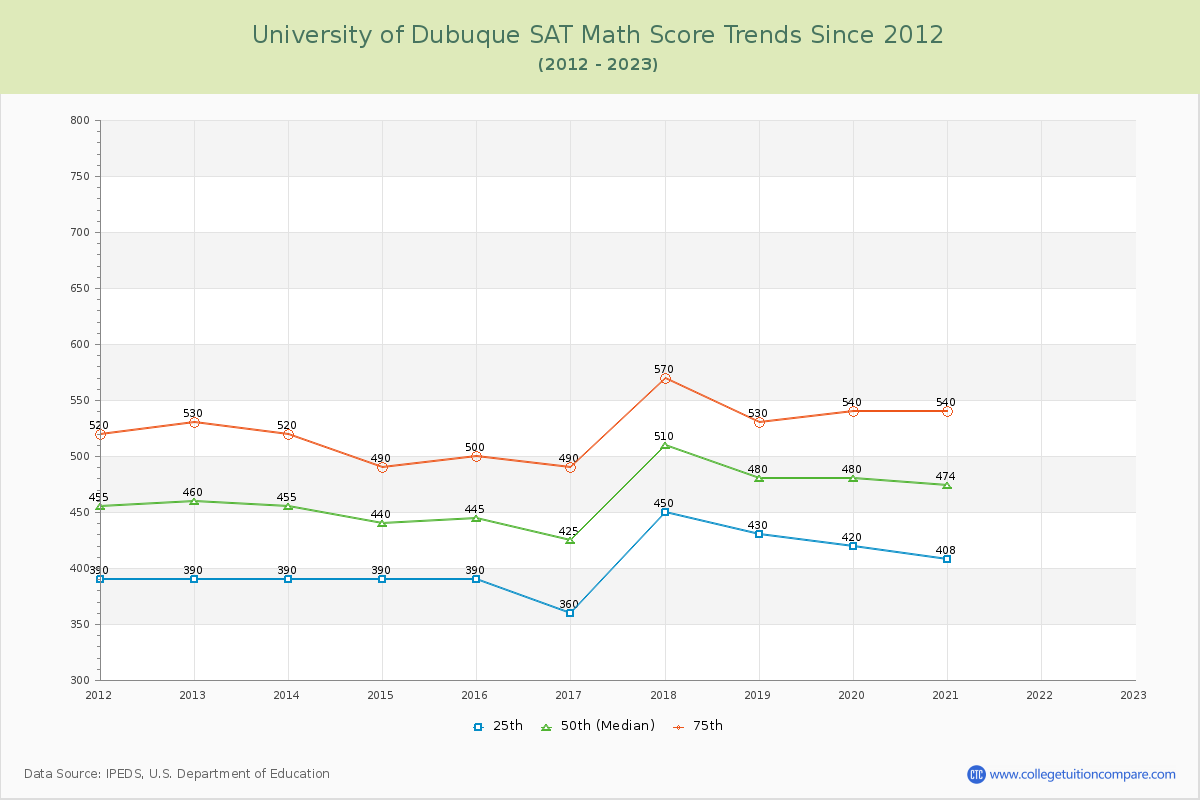
The following table and chart illustrate the changes in SAT scores at University of Dubuque since 2012.
| Year | Total | Math | Evidence-Based Reading and Writing | ||||||
|---|---|---|---|---|---|---|---|---|---|
| 25th | 50th | 75th | 25th | 50th | 75th | 25th | 50th | 75th | |
| 2012-13 | 780 | 910 | 1,040 | 390 | 460 | 530 | 390 | 450 | 510 |
| 2013-14 | 800 | 905 | 1,010 | 390 | 455 | 520 | 410 | 450 | 490 |
| 2014-15 | 780 | 880 | 980 | 390 | 440 | 490 | 390 | 440 | 490 |
| 2015-16 | 810 | 900 | 990 | 390 | 445 | 500 | 420 | 455 | 490 |
| 2016-17 | 740 | 870 | 1,000 | 360 | 425 | 490 | 380 | 445 | 510 |
| 2017-18 | 900 | 1,010 | 1,120 | 450 | 510 | 570 | 450 | 500 | 550 |
| 2018-19 | 850 | 975 | 1,100 | 430 | 480 | 530 | 420 | 495 | 570 |
| 2019-20 | 840 | 960 | 1,080 | 420 | 480 | 540 | 420 | 480 | 540 |
| 2020-21 | 828 | 949 | 1,070 | 408 | 474 | 540 | 420 | 475 | 530 |
| 2021-22 | - | - | - | - | - | - | - | - | - |
| 2022-23 | - | - | - | - | - | - | - | - | - |
| Average | 814 | 929 | 1043 | 403 | 463 | 523 | 411 | 466 | 520 |
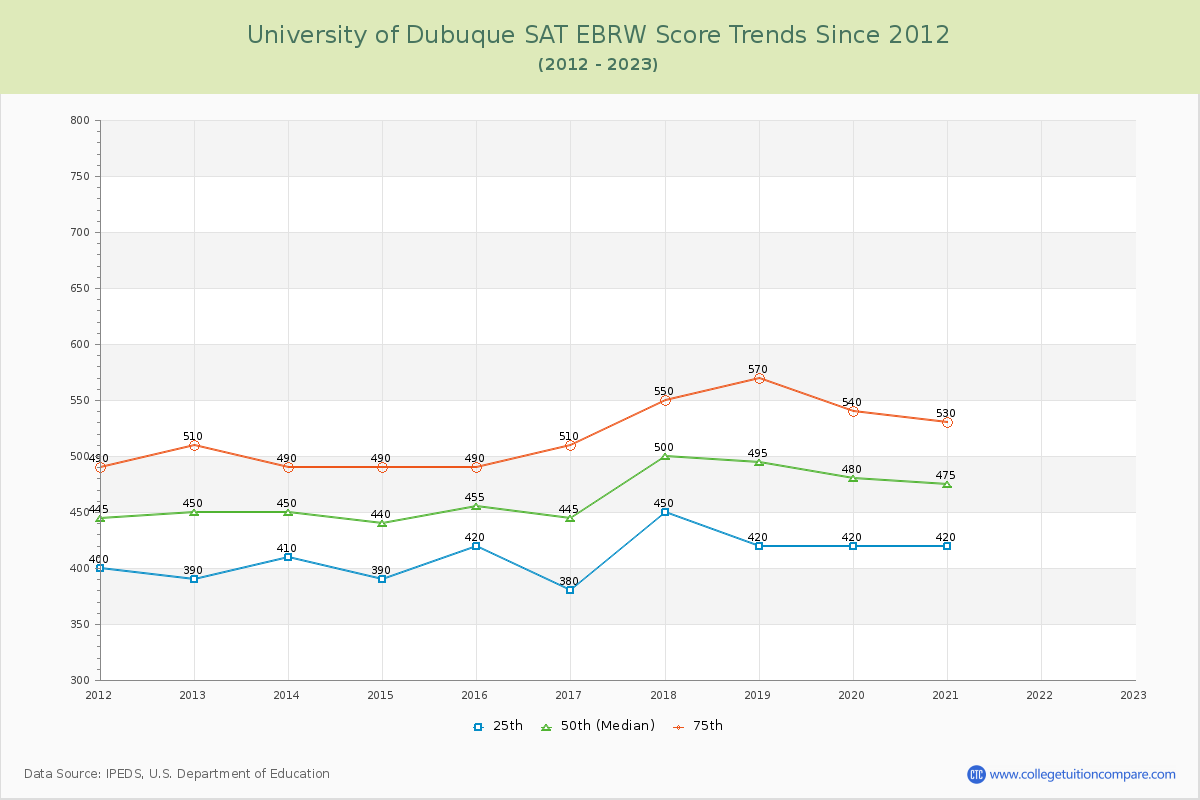
*SAT Evidence-Based Reading and Writing replaces SAT critical reading and writing since year 2017.
**The SAT Writing score is excluded from the total scores for year from 2011 to 2016.