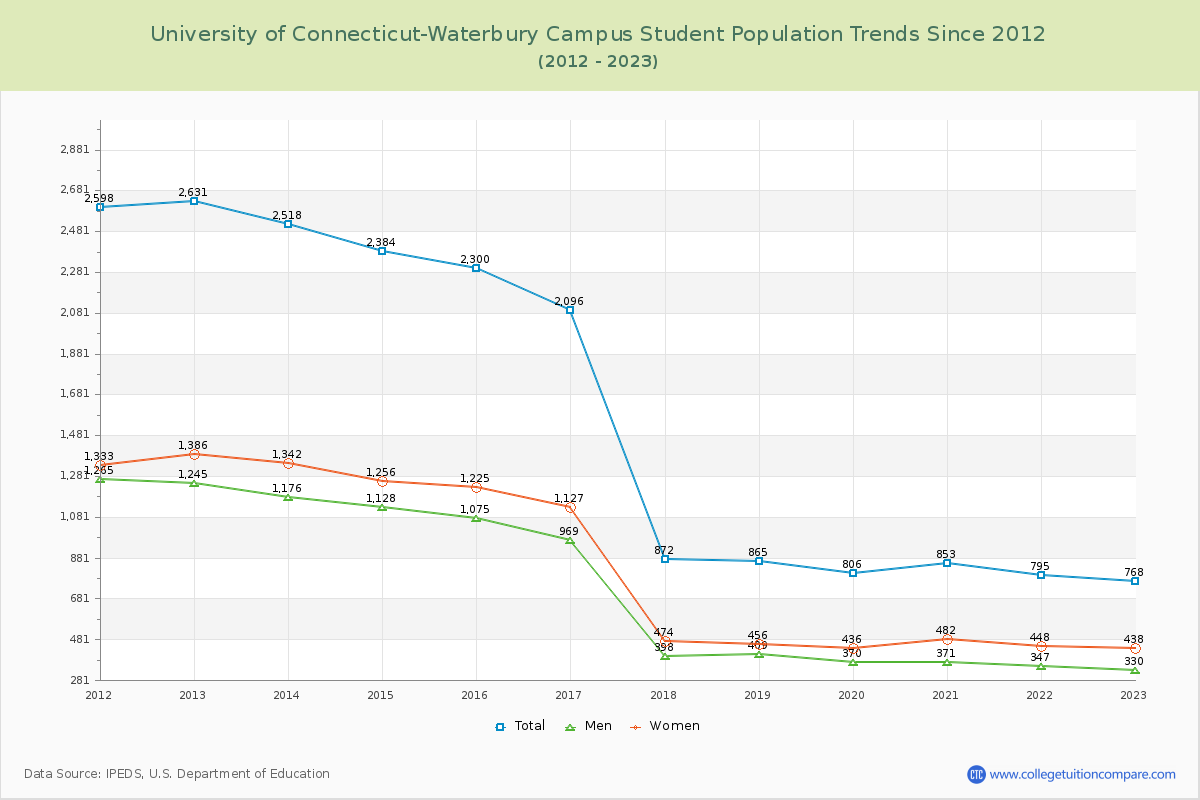
Student Population Changes
The average student population over the last 12 years is 1,535 where 768 students are attending the school for the academic year 2022-2023.
The female to male ratio is 1.33 to 1 and it means that there are more female students enrolled in U of Connecticut-Waterbury Campus than male students.
The following table and chart illustrate the changes in student population by gender at University of Connecticut-Waterbury Campus since 2012.
| Year | Total | Men | Women |
|---|---|---|---|
| 2012-13 | 2,631 | 1,245 | 1,386 |
| 2013-14 | 2,518 -113 | 1,176 -69 | 1,342 -44 |
| 2014-15 | 2,384 -134 | 1,128 -48 | 1,256 -86 |
| 2015-16 | 2,300 -84 | 1,075 -53 | 1,225 -31 |
| 2016-17 | 2,096 -204 | 969 -106 | 1,127 -98 |
| 2017-18 | 872 -1,224 | 398 -571 | 474 -653 |
| 2018-19 | 865 -7 | 409 11 | 456 -18 |
| 2019-20 | 806 -59 | 370 -39 | 436 -20 |
| 2020-21 | 853 47 | 371 1 | 482 46 |
| 2021-22 | 795 -58 | 347 -24 | 448 -34 |
| 2022-23 | 768 -27 | 330 -17 | 438 -10 |
| Average | 1,535 | 711 | 825 |