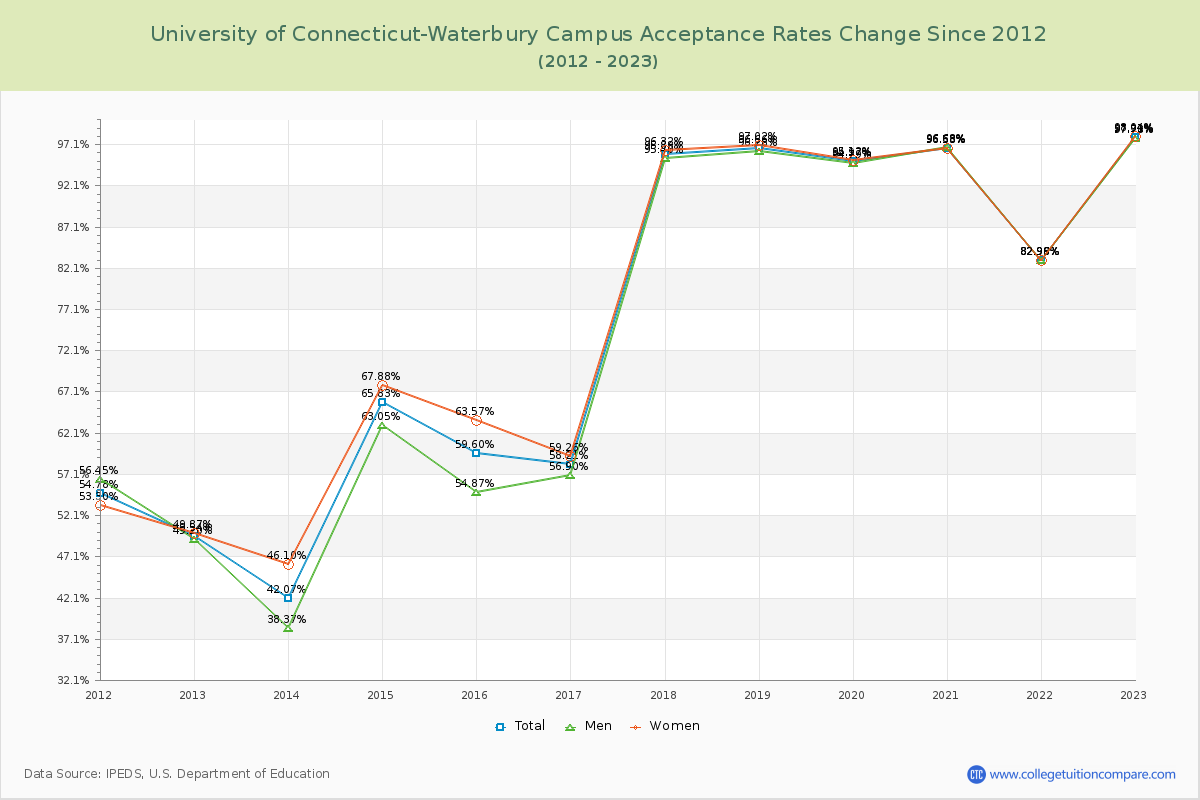
Acceptance Rate Changes
The average acceptance rate over the last 10 years is 76.39%, and this year's acceptance rate is 97.91% at University of Connecticut-Waterbury Campus. By gender, men students' acceptance rate is 75.12% and women students' rate is 77.52%. For 2023 admission, it was easier to get into University of Connecticut-Waterbury Campus than the previous year.
The next table and chart illustrate the acceptance rates changes at University of Connecticut-Waterbury Campus over the past 11 years (2012-2023).
| Year | Total | Men | Women |
|---|---|---|---|
| 2012-13 | 49.54% | 49.20% | 49.87% |
| 2013-14 | 42.07% -7.47% |
38.37% -3.77% |
46.10% -3.77% |
| 2014-15 | 65.83% 23.76% |
63.05% 21.78% |
67.88% 21.78% |
| 2015-16 | 59.60% -6.23% |
54.87% -4.31% |
63.57% -4.31% |
| 2016-17 | 58.21% -1.39% |
56.90% -4.31% |
59.26% -4.31% |
| 2017-18 | 95.88% 37.68% |
95.40% 37.06% |
96.32% 37.06% |
| 2018-19 | 96.66% 0.78% |
96.28% 0.70% |
97.02% 0.70% |
| 2019-20 | 94.97% -1.69% |
94.79% -1.90% |
95.12% -1.90% |
| 2020-21 | 96.63% 1.66% |
96.68% 1.46% |
96.58% 1.46% |
| 2021-22 | 82.98% -13.65% |
82.99% -13.62% |
82.96% -13.62% |
| 2022-23 | 97.91% 14.94% |
97.78% 15.08% |
98.04% 15.08% |
| Average | 76.39% | 75.12% | 77.52% |