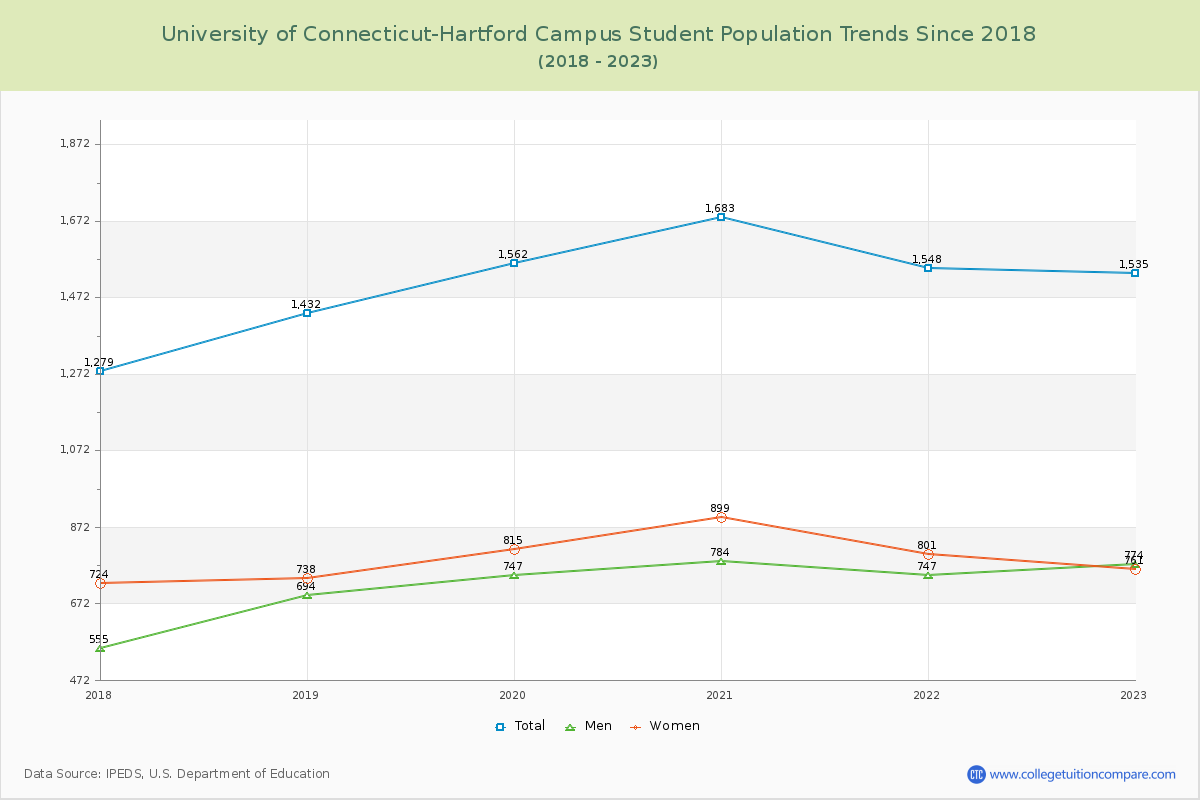
Student Population Changes
The average student population over the last 7 years is 1,507 where 1,535 students are attending the school for the academic year 2022-2023.
The female to male ratio is 0.98 to 1 and it means that there are similar numbers of female and male students enrolled in U of Connecticut-Hartford Campus.
The following table and chart illustrate the changes in student population by gender at University of Connecticut-Hartford Campus since 2017.
| Year | Total | Men | Women |
|---|---|---|---|
| 2017-18 | 1,279 | 555 | 724 |
| 2018-19 | 1,432 153 | 694 139 | 738 14 |
| 2019-20 | 1,562 130 | 747 53 | 815 77 |
| 2020-21 | 1,683 121 | 784 37 | 899 84 |
| 2021-22 | 1,548 -135 | 747 -37 | 801 -98 |
| 2022-23 | 1,535 -13 | 774 27 | 761 -40 |
| Average | 1,507 | 717 | 790 |