SAT Scores Over Time
The 2023 SAT score is 1115 at U of Connecticut-Hartford Campus. Over the past 7 years, the average SAT score is 1010 (25th percentile) and 1210 (75th percentile). Compared to similar schools, the submitted SAT scores are around national average at U of Connecticut-Hartford Campus.
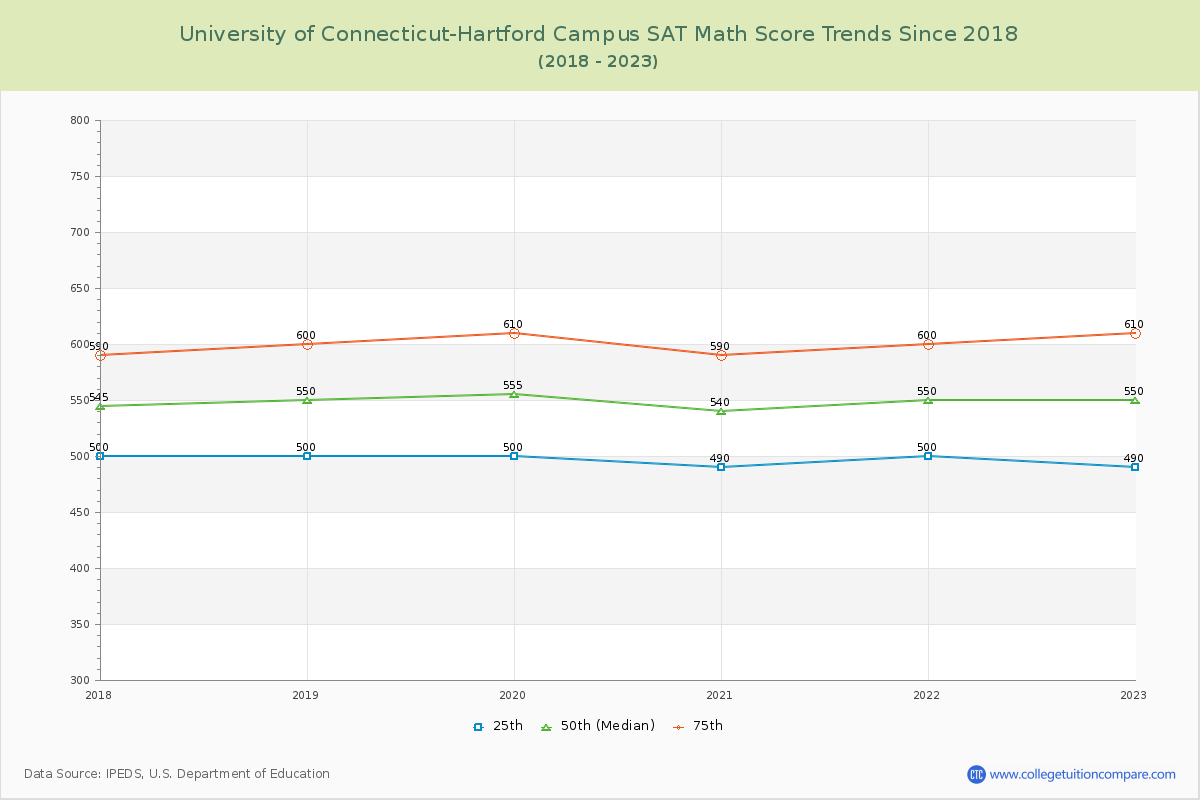
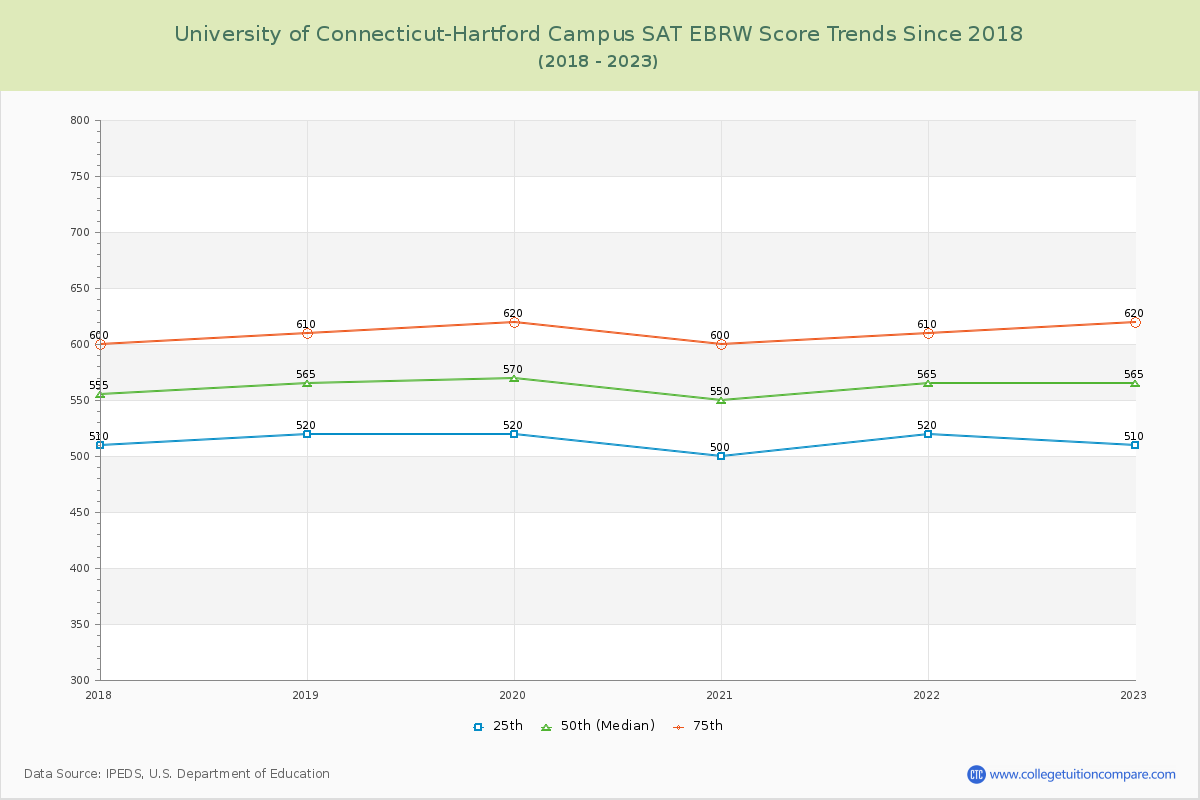
The following table and chart illustrate the changes in SAT scores at University of Connecticut-Hartford Campus since 2017.
| Year | Total | Math | Evidence-Based Reading and Writing | ||||||
|---|---|---|---|---|---|---|---|---|---|
| 25th | 50th | 75th | 25th | 50th | 75th | 25th | 50th | 75th | |
| 2017-18 | 1,010 | 1,100 | 1,190 | 500 | 545 | 590 | 510 | 555 | 600 |
| 2018-19 | 1,020 | 1,115 | 1,210 | 500 | 550 | 600 | 520 | 565 | 610 |
| 2019-20 | 1,020 | 1,125 | 1,230 | 500 | 555 | 610 | 520 | 570 | 620 |
| 2020-21 | 990 | 1,090 | 1,190 | 490 | 540 | 590 | 500 | 550 | 600 |
| 2021-22 | 1,020 | 1,115 | 1,210 | 500 | 550 | 600 | 520 | 565 | 610 |
| 2022-23 | 1,000 | 1,115 | 1,230 | 490 | 550 | 610 | 510 | 565 | 620 |
| Average | 1010 | 1110 | 1210 | 497 | 548 | 600 | 513 | 562 | 610 |
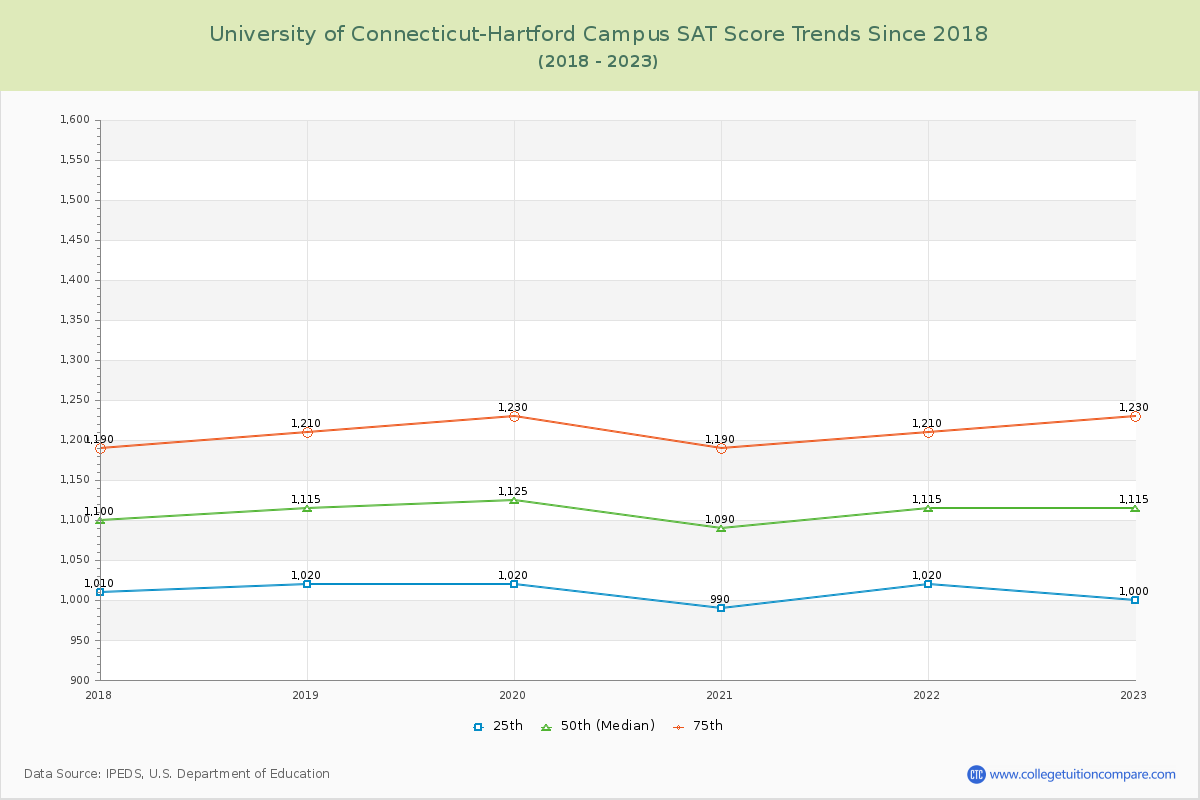
*SAT Evidence-Based Reading and Writing replaces SAT critical reading and writing since year 2017.
**The SAT Writing score is excluded from the total scores for year from 2011 to 2016.