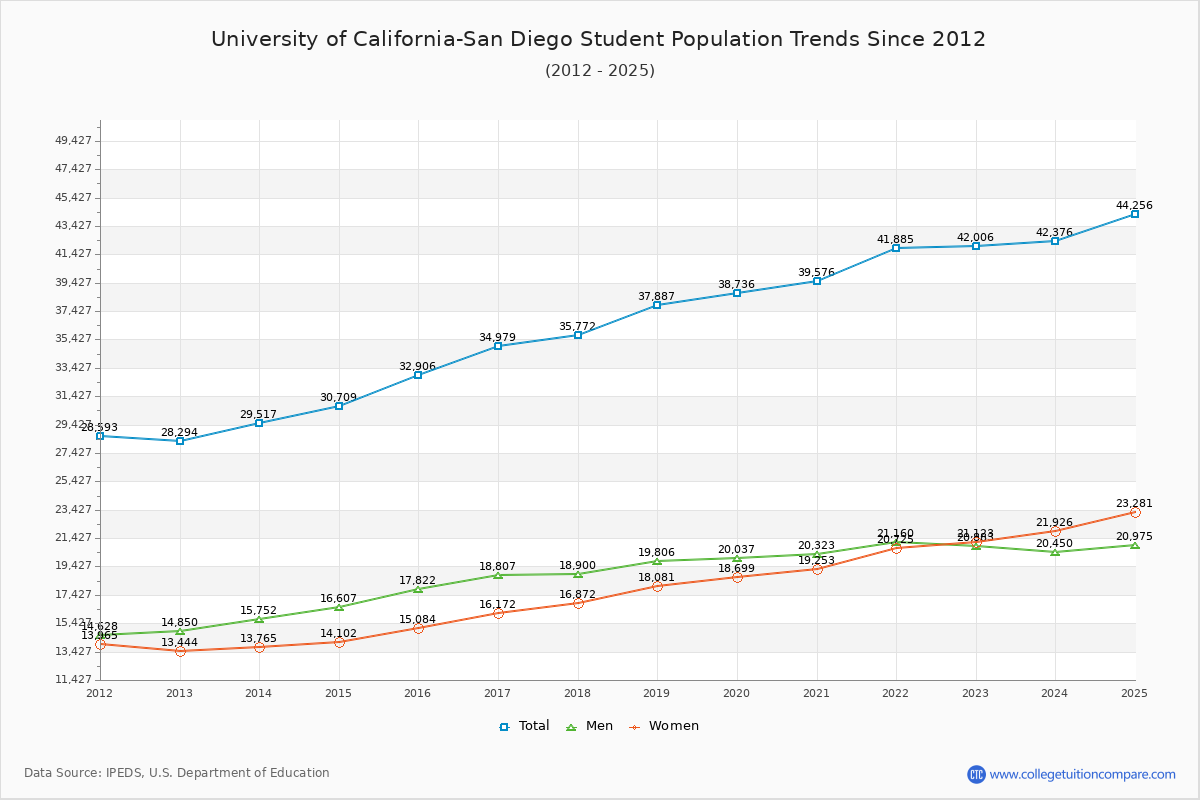
Student Population Changes
The average student population over the last 12 years is 35,661 where 42,006 students are attending the school for the academic year 2022-2023.
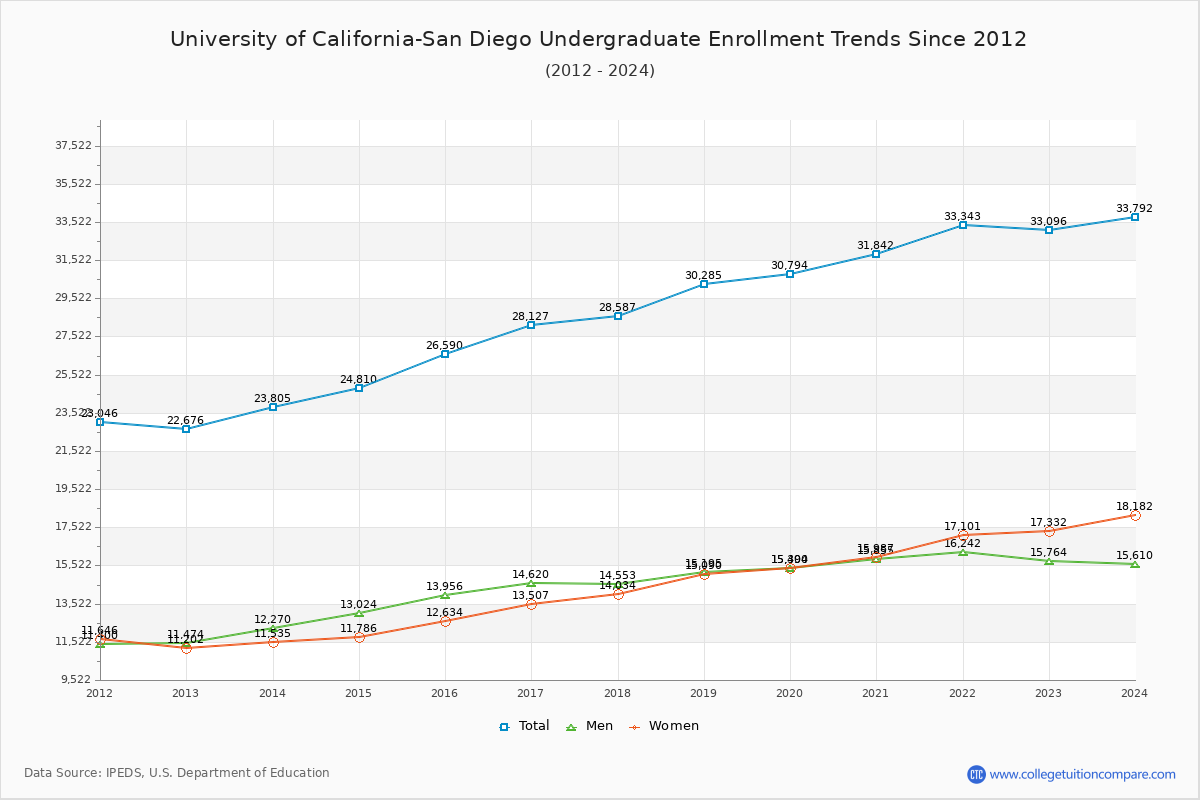
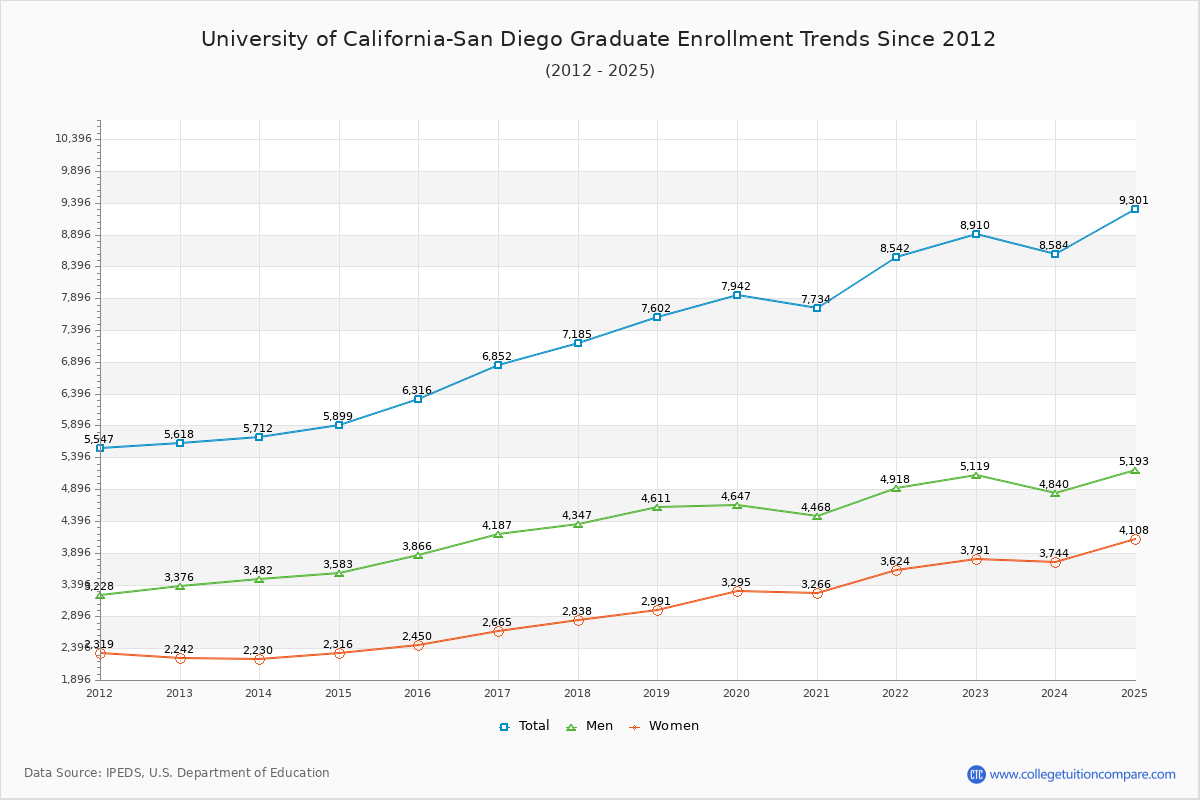
78.79% of total students is undergraduate students and 21.21% students is graduate students. The number of undergraduate students has increased by 10,420 and the graduate enrollment has increased by 3,292 over past 10 years.
The female to male ratio is 1.01 to 1 and it means that there are similar numbers of female and male students enrolled in UCSD.
The following table and chart illustrate the changes in student population by gender at University of California-San Diego since 2012.
| Year | Total | Undergraduate | Graduate | ||||
|---|---|---|---|---|---|---|---|
| Total | Men | Women | Total | Men | Women | ||
| 2012-13 | 28,294 | 22,676 | 11,474 | 11,202 | 5,618 | 3,376 | 2,242 |
| 2013-14 | 29,517 1,223 | 23,805 1,129 | 12,270 796 | 11,535 333 | 5,712 94 | 3,482 106 | 2,230 -12 |
| 2014-15 | 30,709 1,192 | 24,810 1,005 | 13,024 754 | 11,786 251 | 5,899 187 | 3,583 101 | 2,316 86 |
| 2015-16 | 32,906 2,197 | 26,590 1,780 | 13,956 932 | 12,634 848 | 6,316 417 | 3,866 283 | 2,450 134 |
| 2016-17 | 34,979 2,073 | 28,127 1,537 | 14,620 664 | 13,507 873 | 6,852 536 | 4,187 321 | 2,665 215 |
| 2017-18 | 35,772 793 | 28,587 460 | 14,553 -67 | 14,034 527 | 7,185 333 | 4,347 160 | 2,838 173 |
| 2018-19 | 37,887 2,115 | 30,285 1,698 | 15,195 642 | 15,090 1,056 | 7,602 417 | 4,611 264 | 2,991 153 |
| 2019-20 | 38,736 849 | 30,794 509 | 15,390 195 | 15,404 314 | 7,942 340 | 4,647 36 | 3,295 304 |
| 2020-21 | 39,576 840 | 31,842 1,048 | 15,855 465 | 15,987 583 | 7,734 -208 | 4,468 -179 | 3,266 -29 |
| 2021-22 | 41,885 2,309 | 33,343 1,501 | 16,242 387 | 17,101 1,114 | 8,542 808 | 4,918 450 | 3,624 358 |
| 2022-23 | 42,006 121 | 33,096 -247 | 15,764 -478 | 17,332 231 | 8,910 368 | 5,119 201 | 3,791 167 |
| Average | 35,661 | 28,541 | 14,395 | 14,147 | 7,119 | 4,237 | 2,883 |