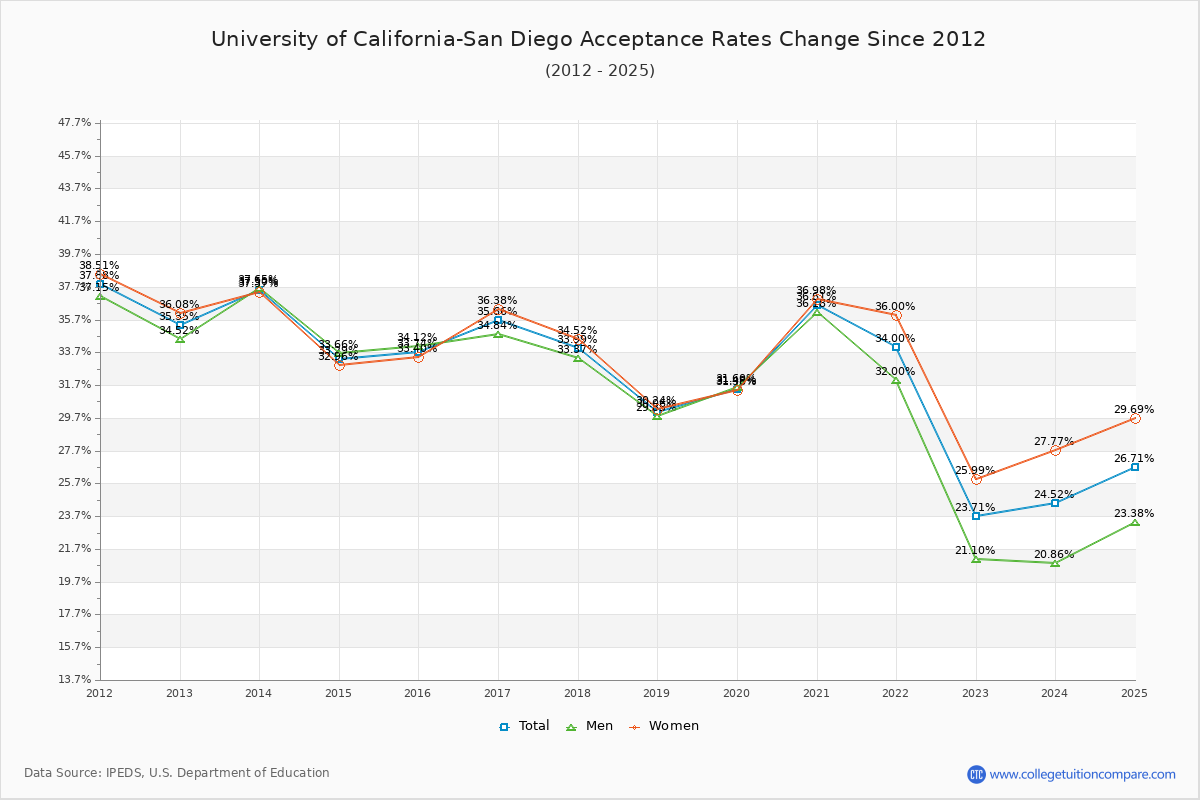
Acceptance Rate Changes
The average acceptance rate over the last 10 years is 33.22%, and this year's acceptance rate is 23.71% at University of California-San Diego. By gender, men students' acceptance rate is 32.63% and women students' rate is 33.75%. For 2023 admission, it was slightly harder to get into University of California-San Diego than the previous year.
The next table and chart illustrate the acceptance rates changes at University of California-San Diego over the past 11 years (2012-2023).
| Year | Total | Men | Women |
|---|---|---|---|
| 2012-13 | 35.35% | 34.52% | 36.08% |
| 2013-14 | 37.50% 2.15% |
37.65% 1.28% |
37.37% 1.28% |
| 2014-15 | 33.29% -4.21% |
33.66% -4.40% |
32.96% -4.40% |
| 2015-16 | 33.74% 0.45% |
34.12% 0.44% |
33.40% 0.44% |
| 2016-17 | 35.66% 1.92% |
34.84% 2.98% |
36.38% 2.98% |
| 2017-18 | 33.99% -1.67% |
33.37% -1.86% |
34.52% -1.86% |
| 2018-19 | 30.06% -3.93% |
29.85% -4.28% |
30.24% -4.28% |
| 2019-20 | 31.48% 1.42% |
31.60% 1.13% |
31.38% 1.13% |
| 2020-21 | 36.61% 5.13% |
36.18% 5.61% |
36.98% 5.61% |
| 2021-22 | 34.00% -2.61% |
32.00% -0.98% |
36.00% -0.98% |
| 2022-23 | 23.71% -10.29% |
21.10% -10.01% |
25.99% -10.01% |
| Average | 33.22% | 32.63% | 33.75% |