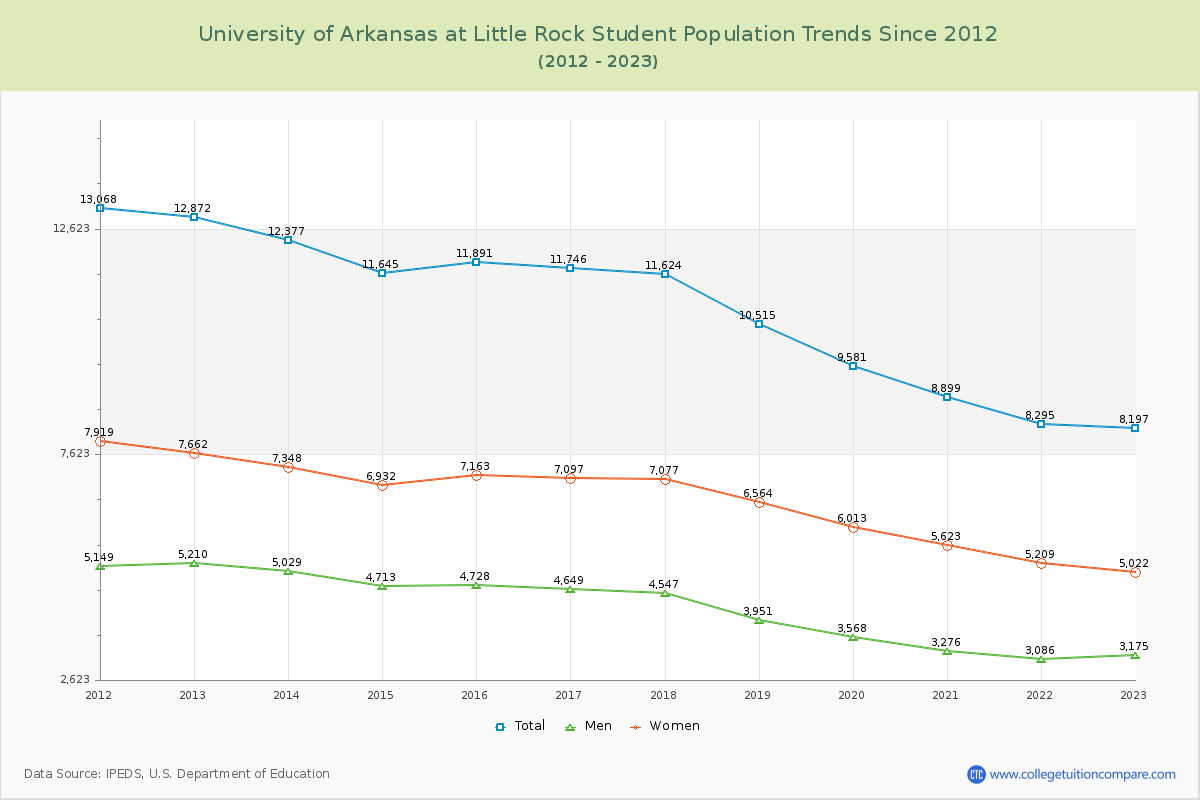
Student Population Changes
The average student population over the last 12 years is 10,695 where 8,197 students are attending the school for the academic year 2022-2023.
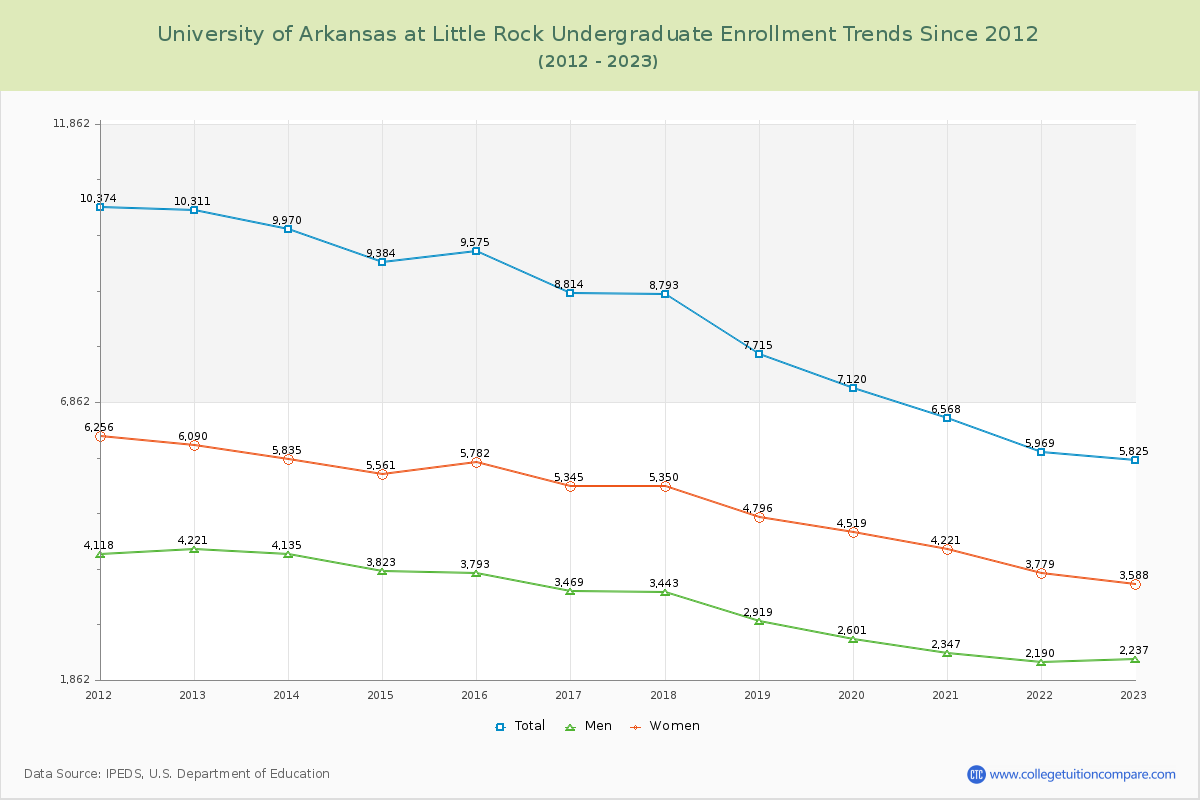
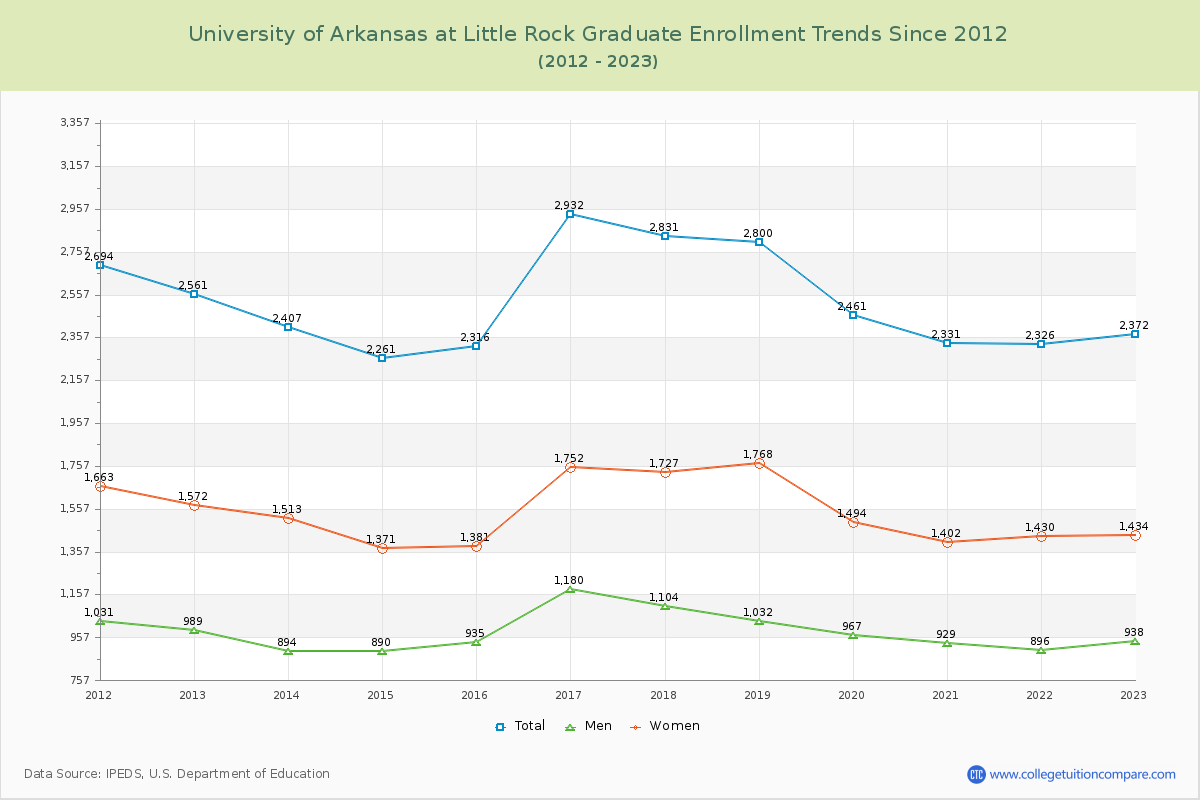
71.06% of total students is undergraduate students and 28.94% students is graduate students. The number of undergraduate students has decreased by 4,486 and the graduate enrollment has decreased by 189 over past 10 years.
The female to male ratio is 1.58 to 1 and it means that there are more female students enrolled in UA Little Rock than male students.
The following table and chart illustrate the changes in student population by gender at University of Arkansas at Little Rock since 2012.
| Year | Total | Undergraduate | Graduate | ||||
|---|---|---|---|---|---|---|---|
| Total | Men | Women | Total | Men | Women | ||
| 2012-13 | 12,872 | 10,311 | 4,221 | 6,090 | 2,561 | 989 | 1,572 |
| 2013-14 | 12,377 -495 | 9,970 -341 | 4,135 -86 | 5,835 -255 | 2,407 -154 | 894 -95 | 1,513 -59 |
| 2014-15 | 11,645 -732 | 9,384 -586 | 3,823 -312 | 5,561 -274 | 2,261 -146 | 890 -4 | 1,371 -142 |
| 2015-16 | 11,891 246 | 9,575 191 | 3,793 -30 | 5,782 221 | 2,316 55 | 935 45 | 1,381 10 |
| 2016-17 | 11,746 -145 | 8,814 -761 | 3,469 -324 | 5,345 -437 | 2,932 616 | 1,180 245 | 1,752 371 |
| 2017-18 | 11,624 -122 | 8,793 -21 | 3,443 -26 | 5,350 5 | 2,831 -101 | 1,104 -76 | 1,727 -25 |
| 2018-19 | 10,515 -1,109 | 7,715 -1,078 | 2,919 -524 | 4,796 -554 | 2,800 -31 | 1,032 -72 | 1,768 41 |
| 2019-20 | 9,581 -934 | 7,120 -595 | 2,601 -318 | 4,519 -277 | 2,461 -339 | 967 -65 | 1,494 -274 |
| 2020-21 | 8,899 -682 | 6,568 -552 | 2,347 -254 | 4,221 -298 | 2,331 -130 | 929 -38 | 1,402 -92 |
| 2021-22 | 8,295 -604 | 5,969 -599 | 2,190 -157 | 3,779 -442 | 2,326 -5 | 896 -33 | 1,430 28 |
| 2022-23 | 8,197 -98 | 5,825 -144 | 2,237 47 | 3,588 -191 | 2,372 46 | 938 42 | 1,434 4 |
| Average | 10,695 | 8,186 | 3,198 | 4,988 | 2,509 | 978 | 1,531 |