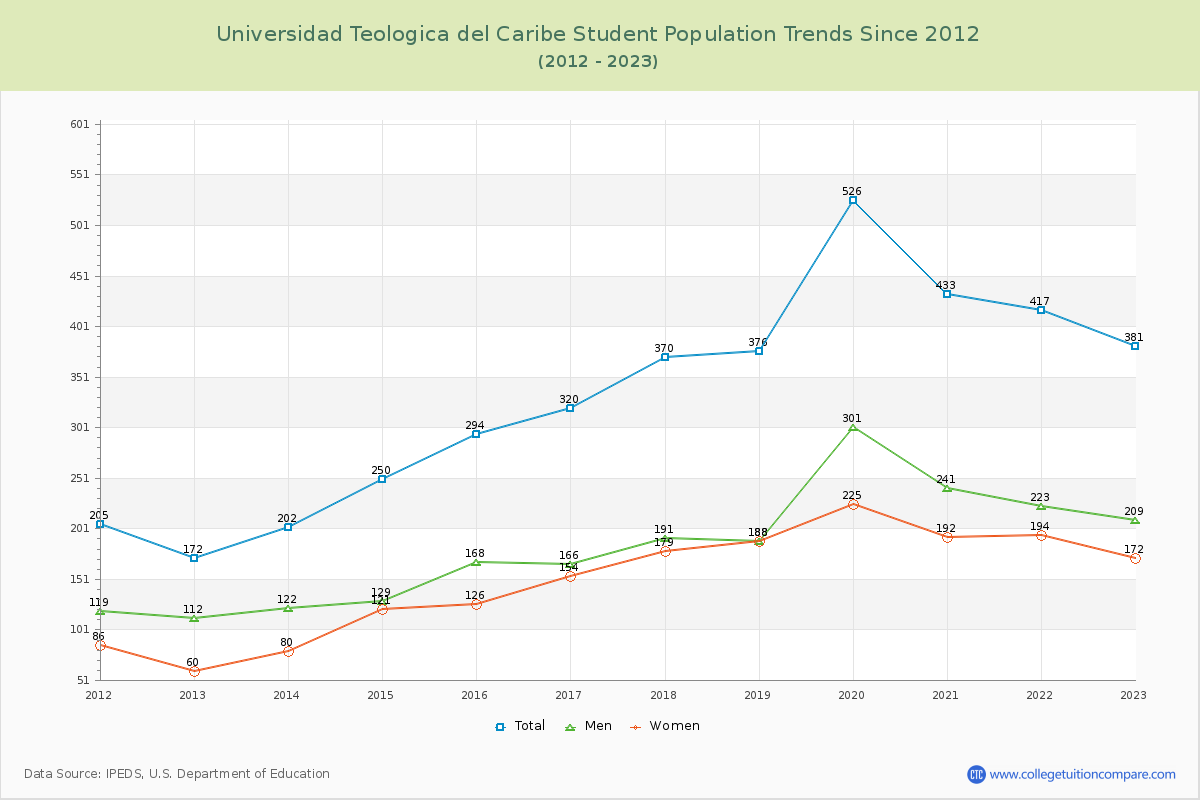
Student Population Changes
The average student population over the last 12 years is 340 where 381 students are attending the school for the academic year 2022-2023.
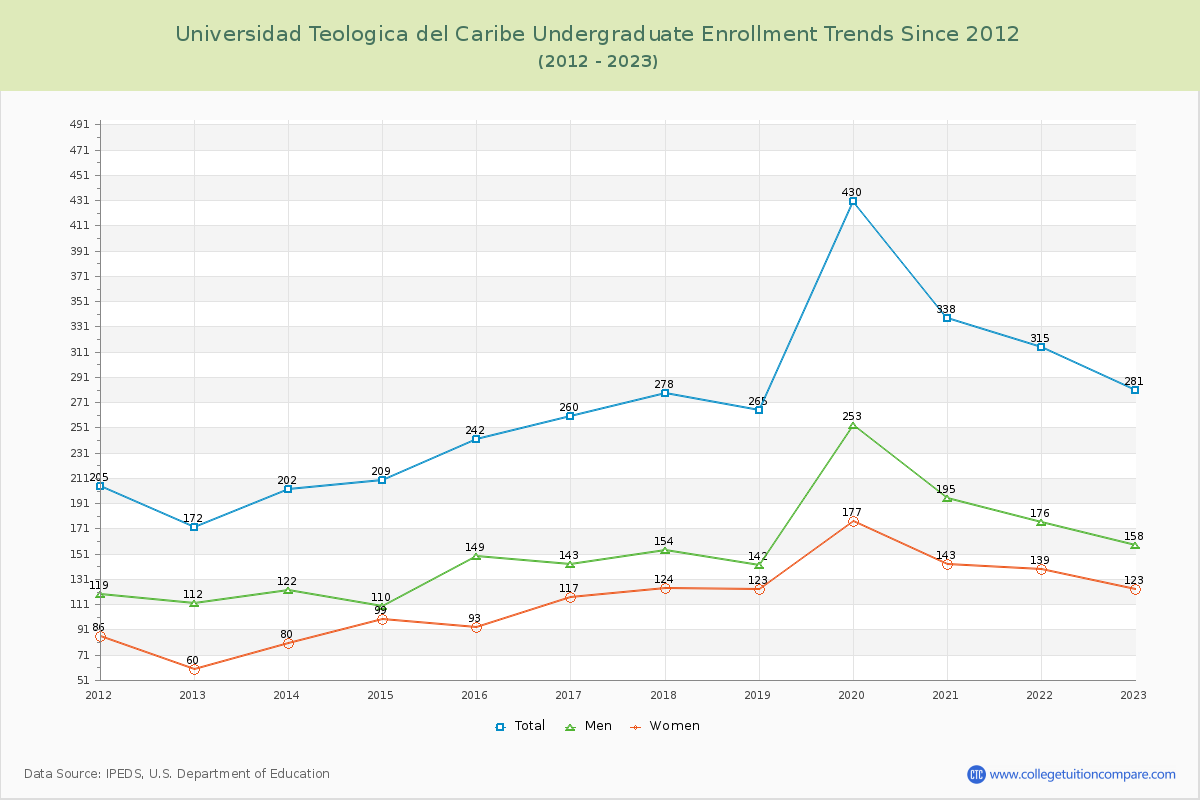
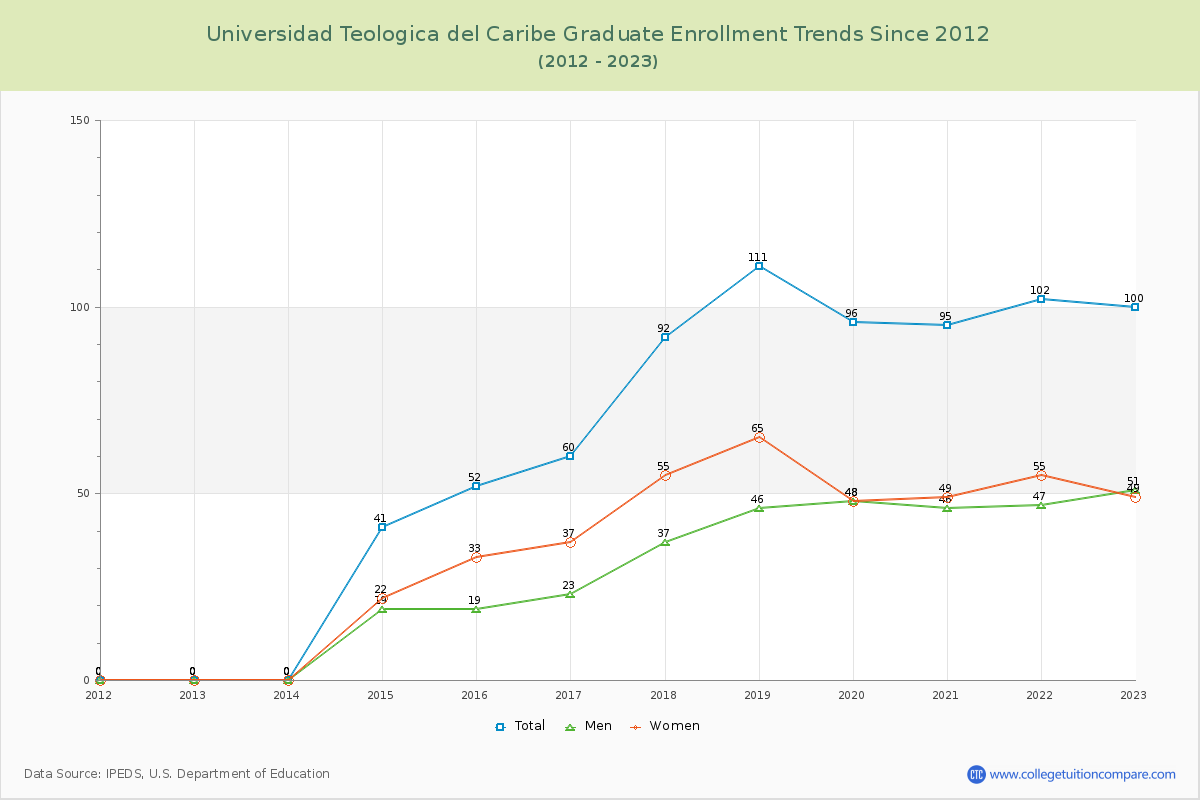
73.75% of total students is undergraduate students and 26.25% students is graduate students. The number of undergraduate students has increased by 109 and the graduate enrollment has increased by 100 over past 10 years.
The female to male ratio is 0.82 to 1 and it means that there are slightly more male students enrolled in UTC than female students.
The following table and chart illustrate the changes in student population by gender at Universidad Teologica del Caribe since 2012.
| Year | Total | Undergraduate | Graduate | ||||
|---|---|---|---|---|---|---|---|
| Total | Men | Women | Total | Men | Women | ||
| 2012-13 | 172 | 172 | 112 | 60 | 0 | 0 | 0 |
| 2013-14 | 202 30 | 202 30 | 122 10 | 80 20 | 0 0 | 0 0 | 0 0 |
| 2014-15 | 250 48 | 209 7 | 110 -12 | 99 19 | 41 41 | 19 19 | 22 22 |
| 2015-16 | 294 44 | 242 33 | 149 39 | 93 -6 | 52 11 | 19 0 | 33 11 |
| 2016-17 | 320 26 | 260 18 | 143 -6 | 117 24 | 60 8 | 23 4 | 37 4 |
| 2017-18 | 370 50 | 278 18 | 154 11 | 124 7 | 92 32 | 37 14 | 55 18 |
| 2018-19 | 376 6 | 265 -13 | 142 -12 | 123 -1 | 111 19 | 46 9 | 65 10 |
| 2019-20 | 526 150 | 430 165 | 253 111 | 177 54 | 96 -15 | 48 2 | 48 -17 |
| 2020-21 | 433 -93 | 338 -92 | 195 -58 | 143 -34 | 95 -1 | 46 -2 | 49 1 |
| 2021-22 | 417 -16 | 315 -23 | 176 -19 | 139 -4 | 102 7 | 47 1 | 55 6 |
| 2022-23 | 381 -36 | 281 -34 | 158 -18 | 123 -16 | 100 -2 | 51 4 | 49 -6 |
| Average | 340 | 272 | 156 | 116 | 68 | 31 | 38 |