Enrollment Trends at Universal Technical Institute of California Inc

-235

Total Enrollment

-266

Men

31

Women

The student population at Universal Technical Institute of California Inc is 1,553 (all undergraduate). The number of students has decreased by 235 over the past decade.

The female to male ratio is 0.06 to 1 which means that majority of population is on male students.

All students have enrolled in on-campus classes (Universal Technical Institute of California Inc does not offer online degree/certificate program).

Student Population Changes

The average student population over the last 11 years is 1,432 where 1,553 students are attending the school for the academic year 2024-2025.

The female to male ratio is 0.06 to 1 and it means that there are far more male students enrolled in Universal Technical Institute of California Inc than female students.

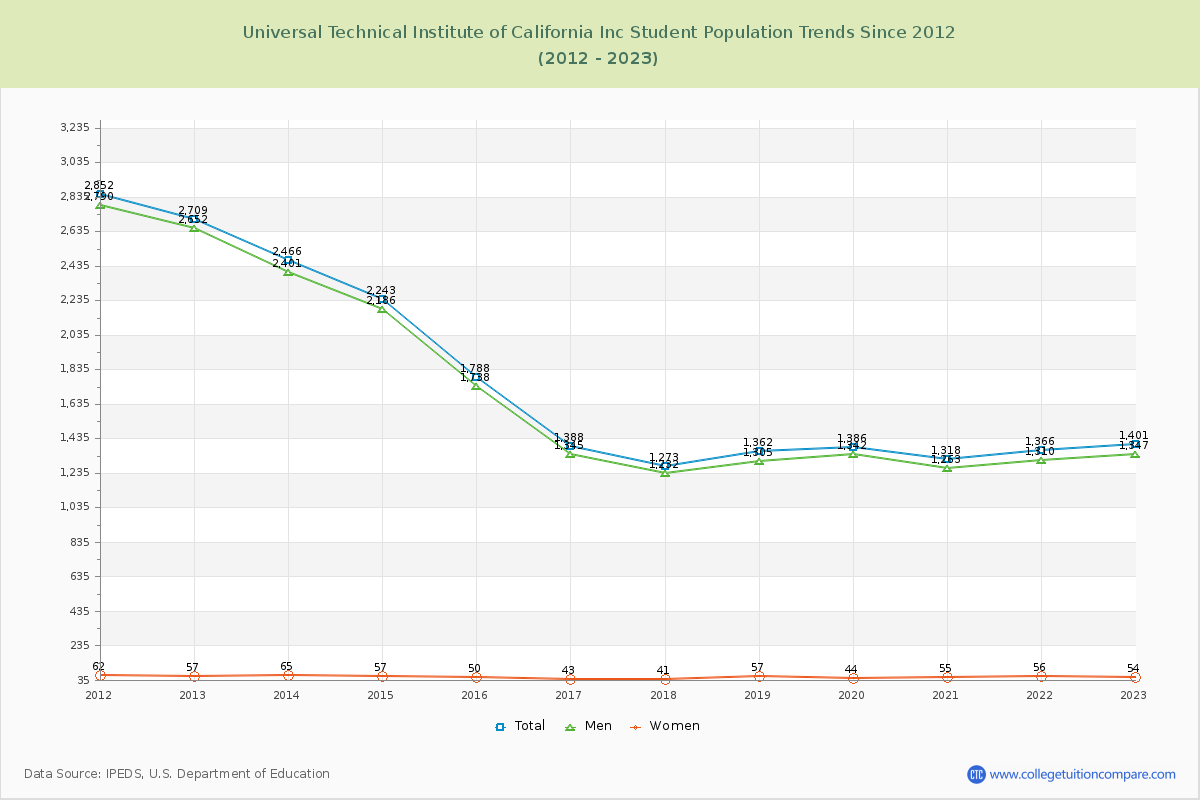
The following table and chart illustrate the changes in student population by gender at Universal Technical Institute of California Inc since 2015.

YearTotalMenWomen
2015-161,7881,73850
2016-171,388
-400
1,345
-393
43
-7
2017-181,273
-115
1,232
-113
41
-2
2018-191,362
89
1,305
73
57
16
2019-201,386
24
1,342
37
44
-13
2020-211,318
-68
1,263
-79
55
11
2021-221,366
48
1,310
47
56
1
2022-231,401
35
1,347
37
54
-2
2023-241,484
83
1,413
66
71
17
2024-251,553
69
1,472
59
81
10
Average1,4321,37755
Universal Technical Institute of California Inc Enrollment Trends Chart

Enrollment by Race/Ethnicity Changes

The percentage of white students is 11.33% and the percentage of black students is 5.02% at Universal Technical Institute of California Inc. 2.51% of enrolled students is Asian. Hispanic students comprise 63.88% of the student body.

Over the past 10 years, the racial composition has shifted. The percentage of white students decreased from 21.09% to 11.33%. Asian enrollment declined from 3.86% to 2.51%. Black student enrollment increased from 3.02% to 5.02%. Hispanic student representation expanded from 60.40% to 63.88%.

The overall racial diversity, measured by the Census Bureau Diversity Index, is 0.5583 which indicates that moderately diverse. This decreased from 0.5832 a decade ago, suggesting that racial diversity has declined.

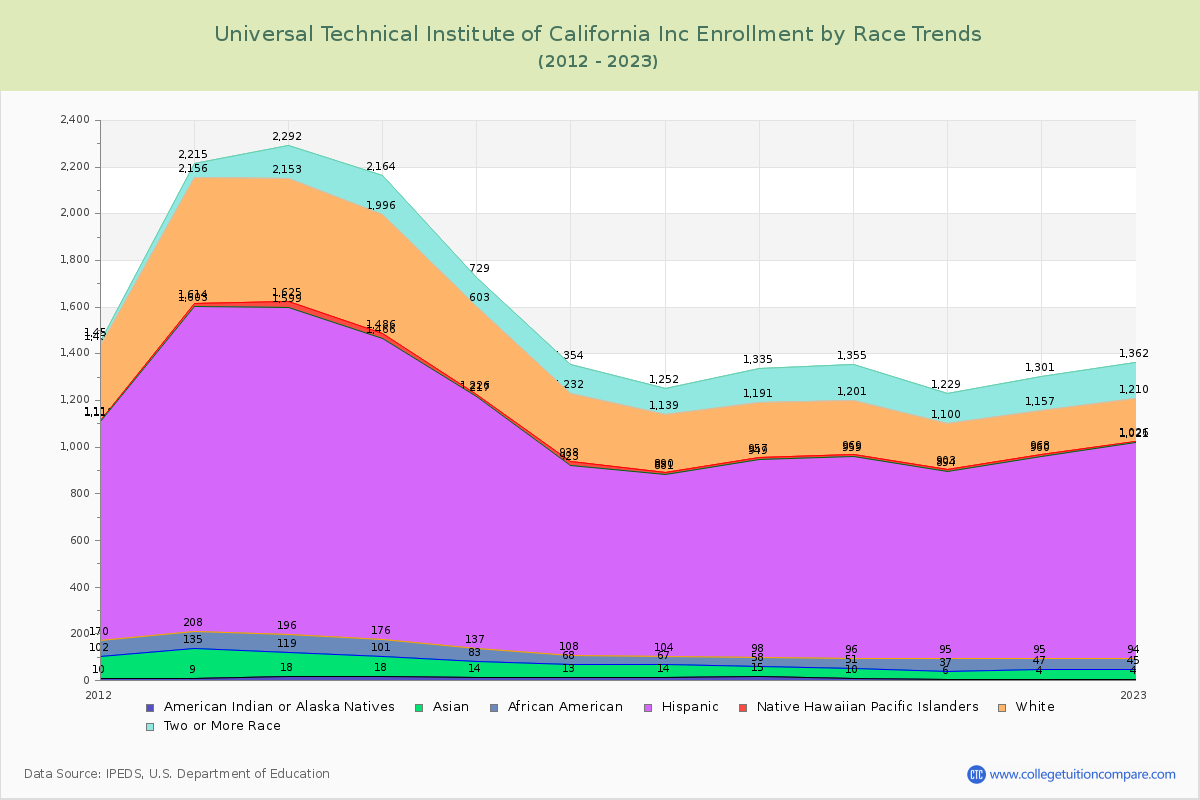
The following table and chart illustrate the student population trends by race/ethnicity at Universal Technical Institute of California Inc over the past 11 years (2015-2025).

YearAmerican Indian or Native AmericanAsianBlackHispanicNative Hawaiian or Other Pacific IslanderWhiteTwo or More Races
2015-161469541,0809377126
2016-1713554081515294122
2017-181453377779249113
2018-191543408518234144
2019-2010414586310232154
2020-21631587999197129
2021-22443488658189144
2022-23441499275184152
2023-241030699707177190
2024-251539789925176206
Average1145528949231148
Universal Technical Institute of California Inc Enrollment by Race Trends Chart

Distance Learning (Online Courses) Enrollment Changes

Universal Technical Institute of California Inc does not offer online degree/certificate programs. All Students have enrolled in on-campus programs.


Ratings & Review

Share your experiences and thoughts about Universal Technical Institute of California Inc. It will be a great help to applicants and prospective students!