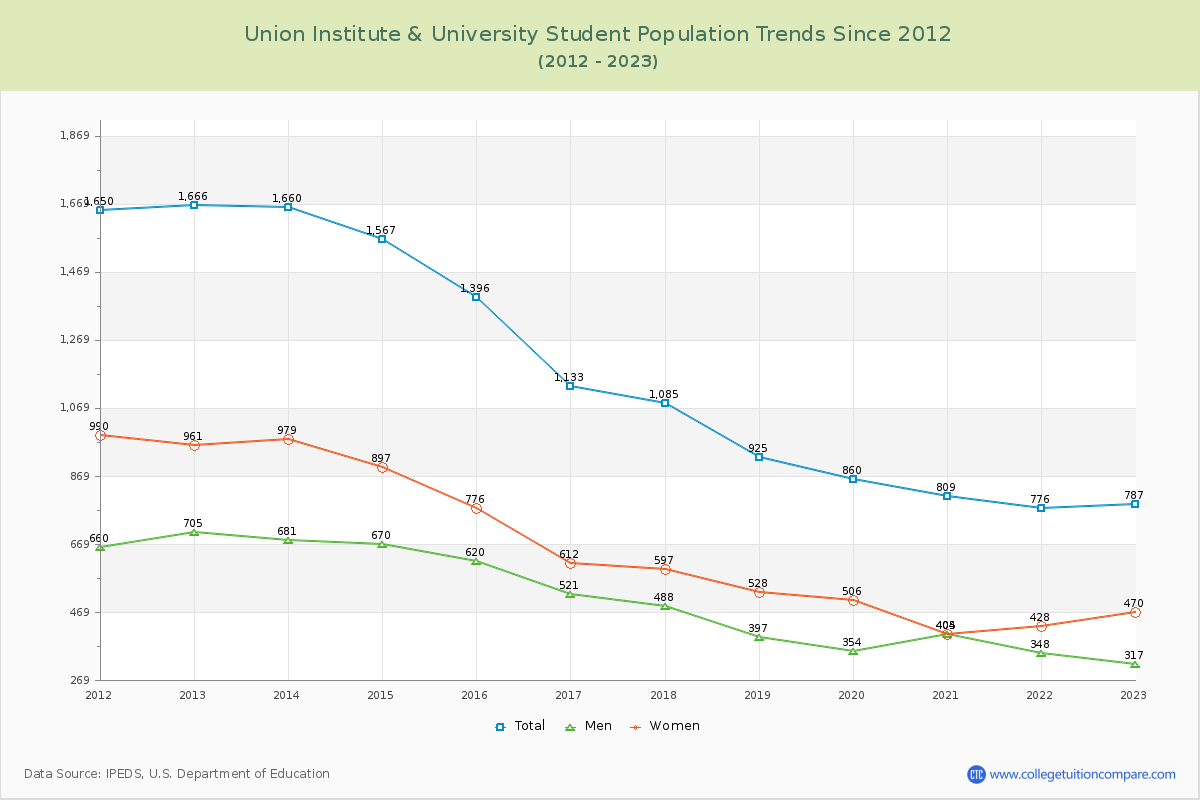
Student Population Changes
The average student population over the last 12 years is 1,151 where 787 students are attending the school for the academic year 2022-2023.
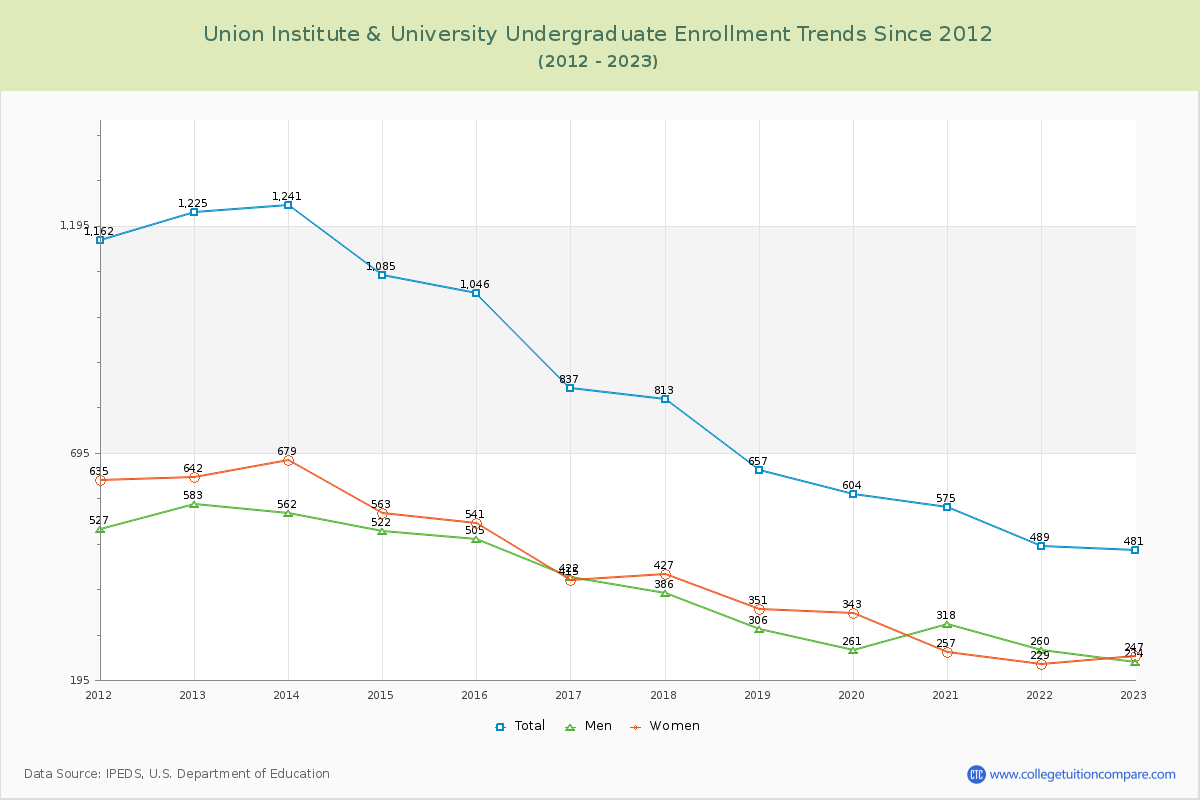
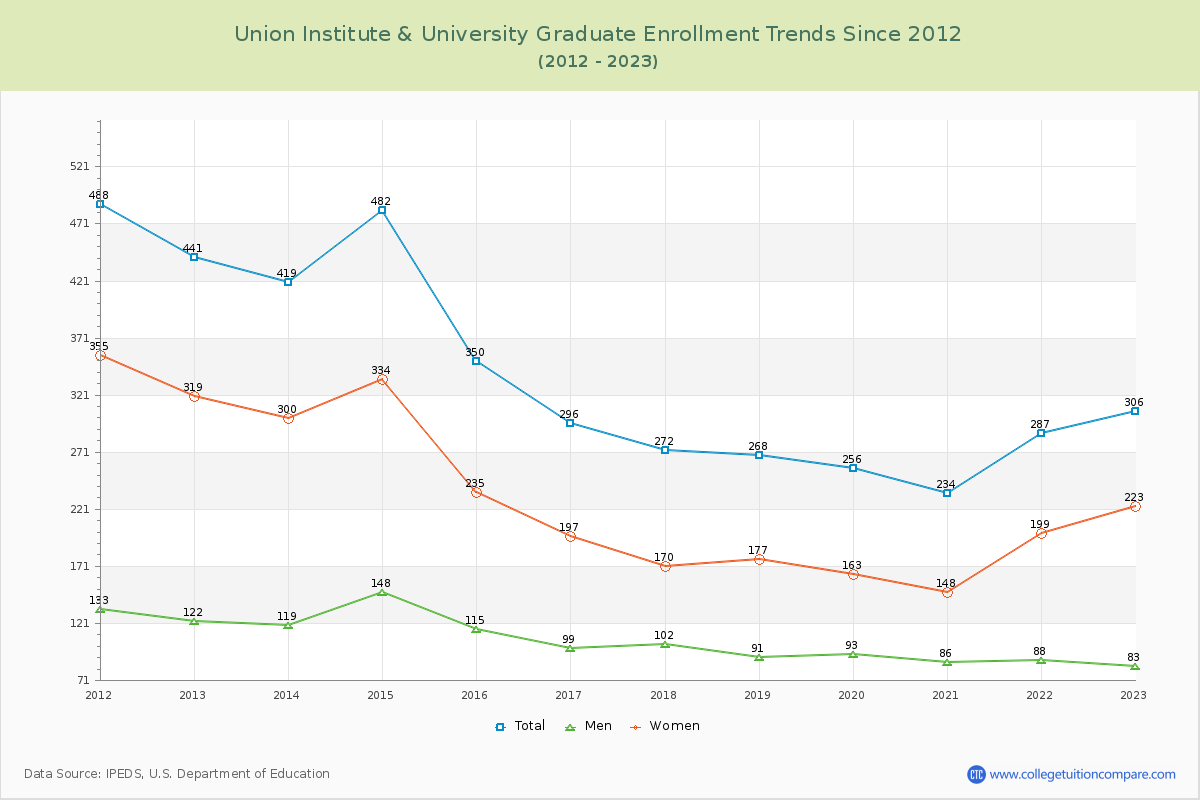
61.12% of total students is undergraduate students and 38.88% students is graduate students. The number of undergraduate students has decreased by 744 and the graduate enrollment has decreased by 135 over past 10 years.
The female to male ratio is 1.48 to 1 and it means that there are more female students enrolled in UI&U than male students.
The following table and chart illustrate the changes in student population by gender at Union Institute & University since 2012.
| Year | Total | Undergraduate | Graduate | ||||
|---|---|---|---|---|---|---|---|
| Total | Men | Women | Total | Men | Women | ||
| 2012-13 | 1,666 | 1,225 | 583 | 642 | 441 | 122 | 319 |
| 2013-14 | 1,660 -6 | 1,241 16 | 562 -21 | 679 37 | 419 -22 | 119 -3 | 300 -19 |
| 2014-15 | 1,567 -93 | 1,085 -156 | 522 -40 | 563 -116 | 482 63 | 148 29 | 334 34 |
| 2015-16 | 1,396 -171 | 1,046 -39 | 505 -17 | 541 -22 | 350 -132 | 115 -33 | 235 -99 |
| 2016-17 | 1,133 -263 | 837 -209 | 422 -83 | 415 -126 | 296 -54 | 99 -16 | 197 -38 |
| 2017-18 | 1,085 -48 | 813 -24 | 386 -36 | 427 12 | 272 -24 | 102 3 | 170 -27 |
| 2018-19 | 925 -160 | 657 -156 | 306 -80 | 351 -76 | 268 -4 | 91 -11 | 177 7 |
| 2019-20 | 860 -65 | 604 -53 | 261 -45 | 343 -8 | 256 -12 | 93 2 | 163 -14 |
| 2020-21 | 809 -51 | 575 -29 | 318 57 | 257 -86 | 234 -22 | 86 -7 | 148 -15 |
| 2021-22 | 776 -33 | 489 -86 | 260 -58 | 229 -28 | 287 53 | 88 2 | 199 51 |
| 2022-23 | 787 11 | 481 -8 | 234 -26 | 247 18 | 306 19 | 83 -5 | 223 24 |
| Average | 1,151 | 823 | 396 | 427 | 328 | 104 | 224 |