Enrollment Trends at Truett McConnell

598

Total Enrollment

321

Men

277

Women

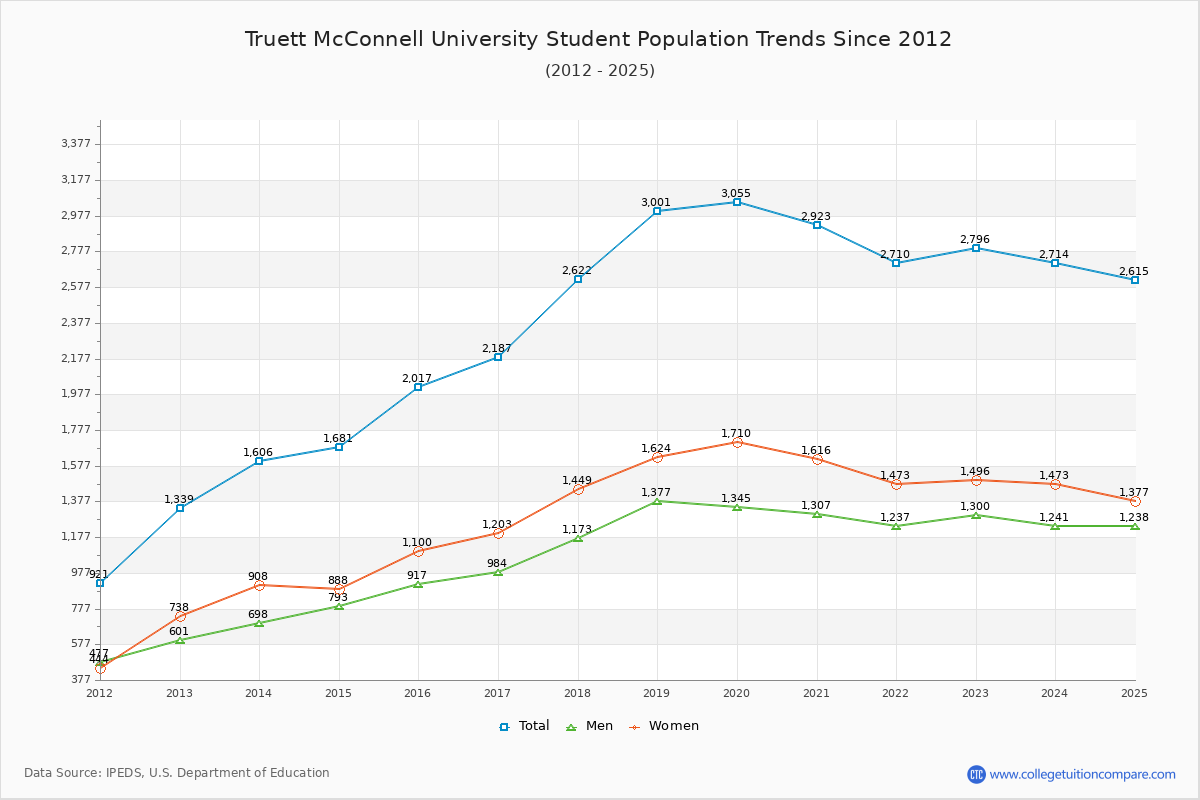
The student population at Truett McConnell University is 2,615 (2,524 undergraduate and 91 graduate students) . The number of students has increased by 598 over the past decade.

The percentage of undergraduate students at Truett McConnell is 96.52% which is increased by 527 over last 10 years. The graduate student population increased by 71 and it has been increasing.

The female to male ratio is 1.11 to 1 which means that female students enrolled slightly more than male students.

1,223 students enrolled in online degree program exclusively and the number of online students has increased by 76.99% since 2015.

Student Population Changes

The average student population over the last 11 years is 2,664 where 2,615 students are attending the school for the academic year 2024-2025.

96.52% of total students is undergraduate students and 3.48% students is graduate students. The number of undergraduate students has increased by 527 and the graduate enrollment has increased by 71 over past 10 years.

The female to male ratio is 1.11 to 1 and it means that there are slightly more female students enrolled in Truett McConnell than male students.

The following table and chart illustrate the changes in student population by gender at Truett McConnell University since 2015.

YearTotalUndergraduateGraduate
TotalMenWomenTotalMenWomen
2015-162,0171,9979001,09720173
2016-172,187
170
2,152
155
957
57
1,195
98
35
15
27
10
8
5
2017-182,622
435
2,573
421
1,136
179
1,437
242
49
14
37
10
12
4
2018-193,001
379
2,919
346
1,324
188
1,595
158
82
33
53
16
29
17
2019-203,055
54
2,983
64
1,308
-16
1,675
80
72
-10
37
-16
35
6
2020-212,923
-132
2,826
-157
1,268
-40
1,558
-117
97
25
39
2
58
23
2021-222,710
-213
2,605
-221
1,193
-75
1,412
-146
105
8
44
5
61
3
2022-232,796
86
2,683
78
1,232
39
1,451
39
113
8
68
24
45
-16
2023-242,714
-82
2,612
-71
1,177
-55
1,435
-16
102
-11
64
-4
38
-7
2024-252,615
-99
2,524
-88
1,184
7
1,340
-95
91
-11
54
-10
37
-1
Average2,6642,5871,1681,420774433
Truett McConnell University Enrollment Trends Chart

Undergraduate Enrollment Changes

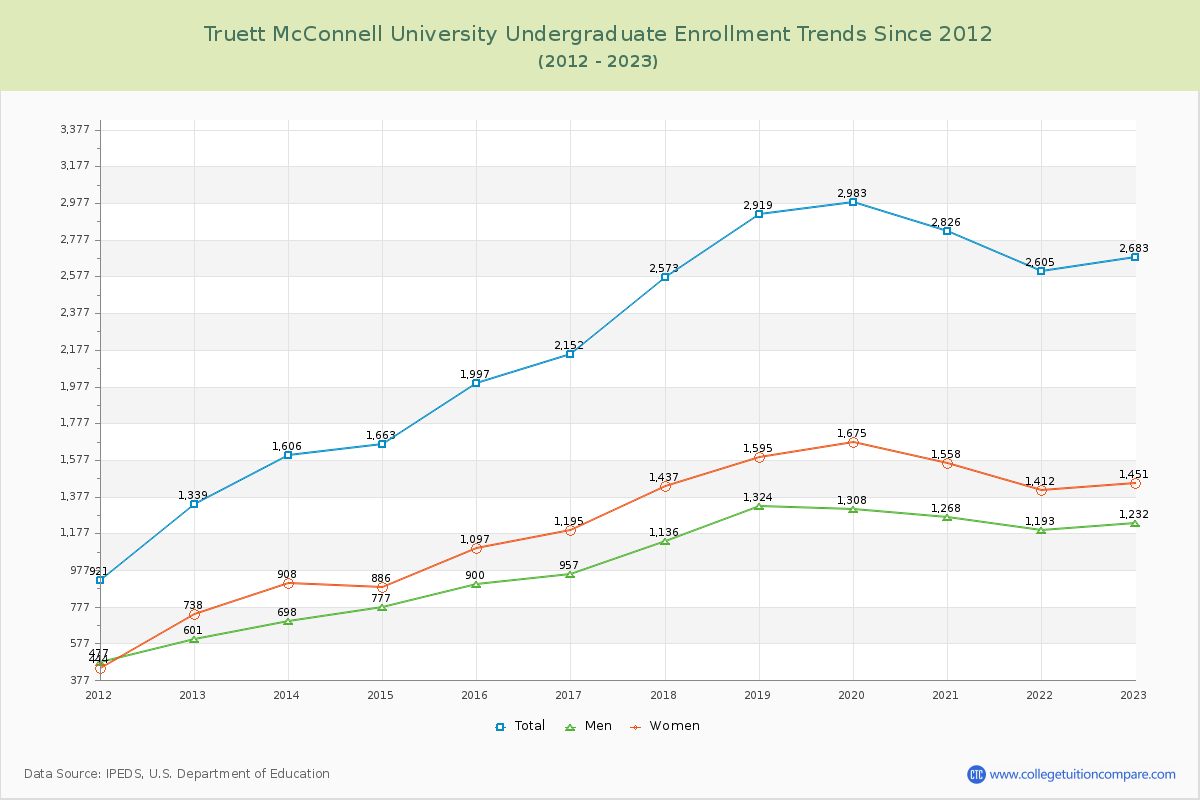
The average number of Undergraduate students over the last 11 years is 2,587 where 2,524 students are attending the Undergraduate school for the academic year 2024-2025. The following table and chart illustrate the changes in Undergraduate enrollment by attending status and gender at Truett McConnell University since 2015.

YearTotalFull-timePart-time
TotalMenWomenTotalMenWomen
2015-161,9977333254081,264575689
2016-172,1527403304101,412627785
2017-182,5737803434371,7937931,000
2018-192,9198884054832,0319191,112
2019-202,9838523554972,1319531,178
2020-212,8268564044521,9708641,106
2021-222,6058343964381,771797974
2022-232,6838273914361,8568411,015
2023-242,6127903894011,8227881,034
2024-252,5247423763661,782808974
Average2,5872,5873714332,587797987
Truett McConnell University Undergraduate Enrollment Trends Chart

Graduate Enrollment Changes

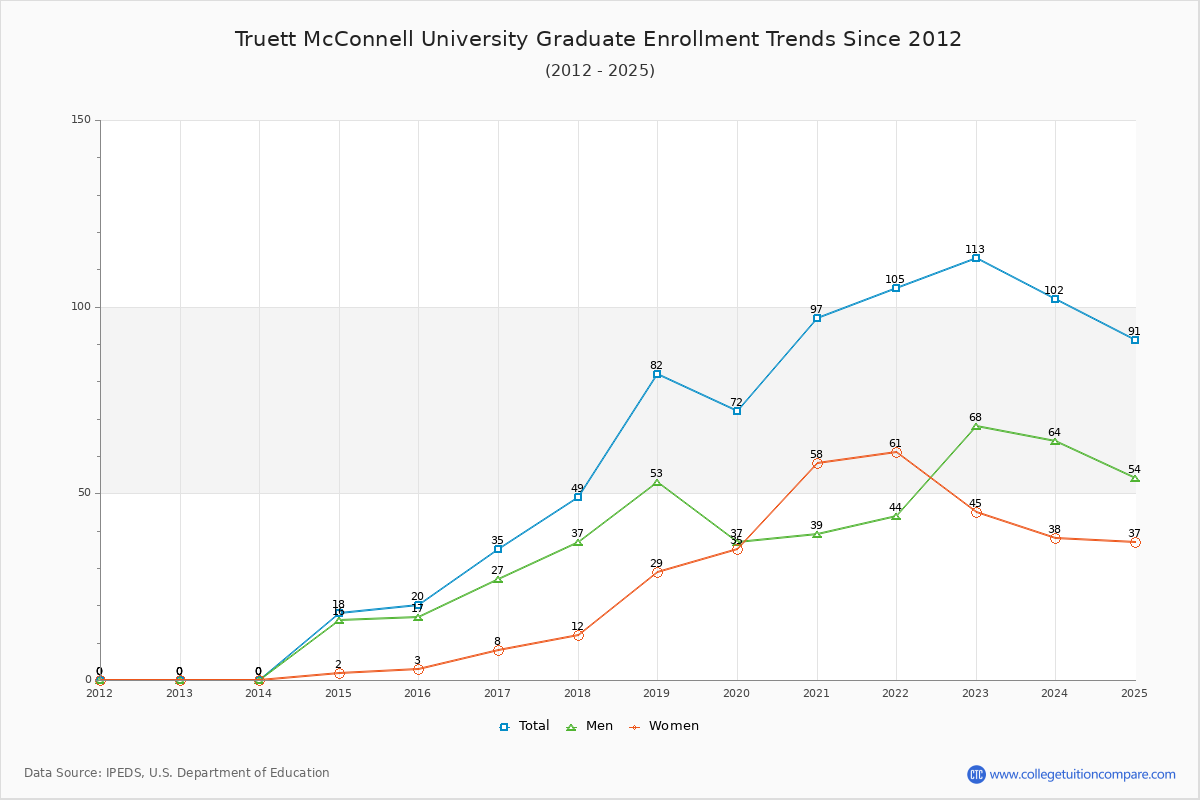
The average number of Graduate students over the last 11 years is 77 where 91 students are attending the Graduate school for the academic year 2024-2025. The following table and chart illustrate the changes in Graduate enrollment by attending status and gender at Truett McConnell University since 2015.

YearTotalFull-timePart-time
TotalMenWomenTotalMenWomen
2015-162015132541
2016-17351817117107
2017-18492623323149
2018-1982493316332013
2019-2072381820341915
2020-2197602040371918
2021-22105672344382117
2022-23113714526422319
2023-24102573225453213
2024-259155253036297
Average77772521771912
Truett McConnell University Graduate Enrollment Trends Chart

Enrollment by Race/Ethnicity Changes

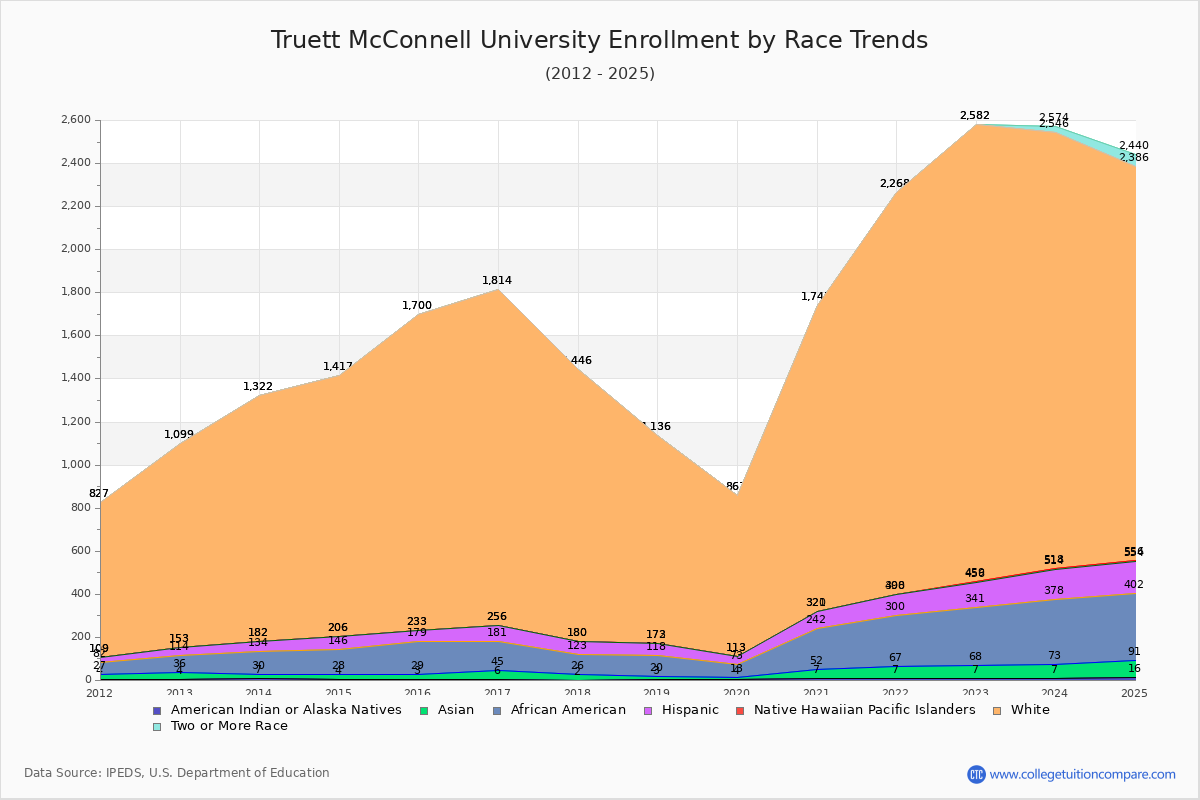
The percentage of white students is 69.98%. The percentage was 72.73% 10 years ago and Truett McConnell still has a high percentage of white students. 2.87% of enrolled students is Asian and 11.89% is black students. Hispanic students comprise 5.81% of the student body.

Over the past 10 years, the racial composition has shifted. The percentage of white students decreased from 72.73% to 69.98%. Asian enrollment grew from 1.29% to 2.87%. Black student enrollment increased from 7.44% to 11.89%. Hispanic student representation expanded from 2.68% to 5.81%.

The overall racial diversity, measured by the Census Bureau Diversity Index, is 0.4915 which indicates that somewhat diverse. This increased from 0.4646 a decade ago, suggesting that racial diversity has improved.

The following table and chart illustrate the student population trends by race/ethnicity at Truett McConnell University over the past 11 years (2015-2025).

YearAmerican Indian or Native AmericanAsianBlackHispanicNative Hawaiian or Other Pacific IslanderWhiteTwo or More Races
2015-163261505401,4670
2016-176391367501,5580
2017-18224975701,2660
2018-19317985419630
2019-2049604007480
2020-217451907811,4200
2021-227602339821,8680
2022-2376127311532,1230
2023-2476630513642,02828
2024-25167531115221,83054
Average6421858611,5278
Truett McConnell University Enrollment by Race Trends Chart

Distance Learning (Online Courses) Enrollment Changes

1,223 students are enrolled in online degree programs exclusively for the academic year 2024-2025, which is 47% of total students. The number of online students has increased 76.99% since 2015. The following table and chart illustrate the changes in the online student population by enrolled type at Truett McConnell University from 2015 to 2025.

YearTotal EnrollmentOnline CompletelyEnrolled in Some Online CoursesNot Enrolled in Online Courses
2015-162,0176912101,116
2016-172,1877492241,214
2017-182,6221,0042451,373
2018-193,0011,2232991,479
2019-203,0551,3073961,352
2020-212,9231,2565001,167
2021-222,7101,1604441,106
2022-232,7961,1841,183429
2023-242,7141,236528950
2024-252,6151,223549843
Average2,6641,1034581,103

Ratings & Review

Share your experiences and thoughts about Truett McConnell University. It will be a great help to applicants and prospective students!