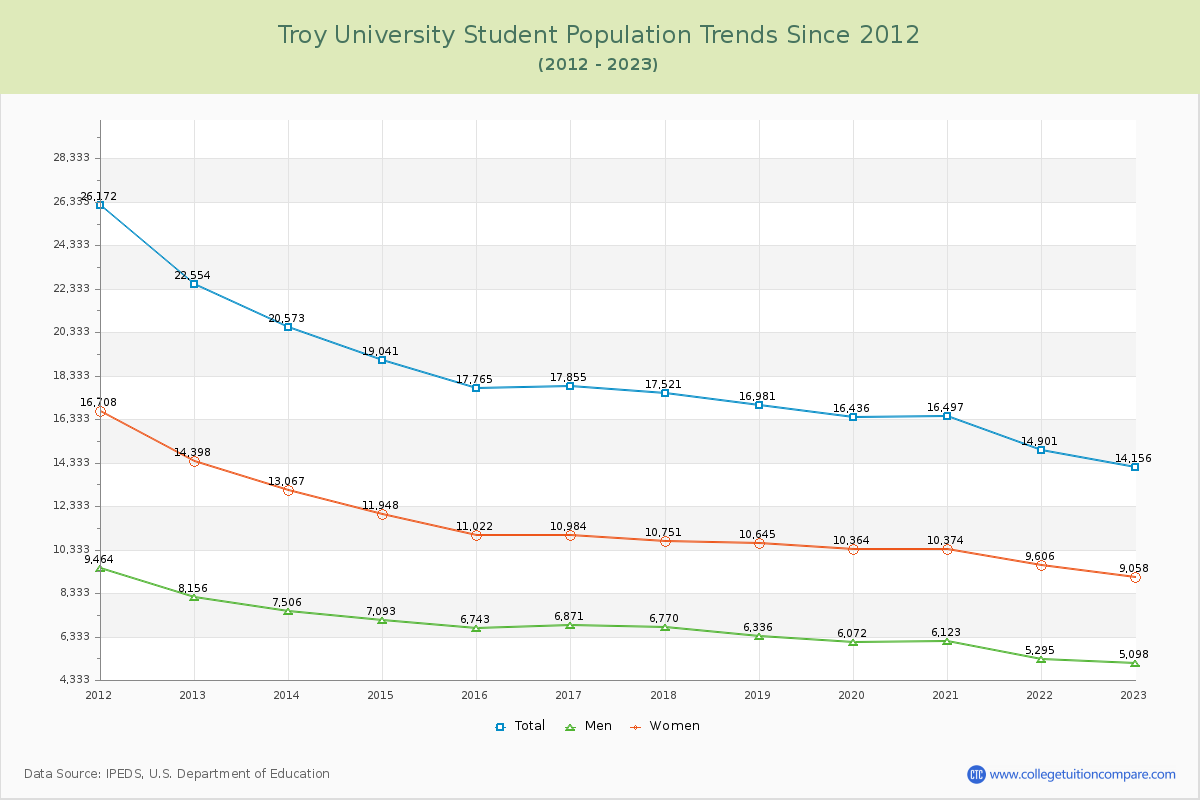
Student Population Changes
The average student population over the last 12 years is 17,662 where 14,156 students are attending the school for the academic year 2022-2023.
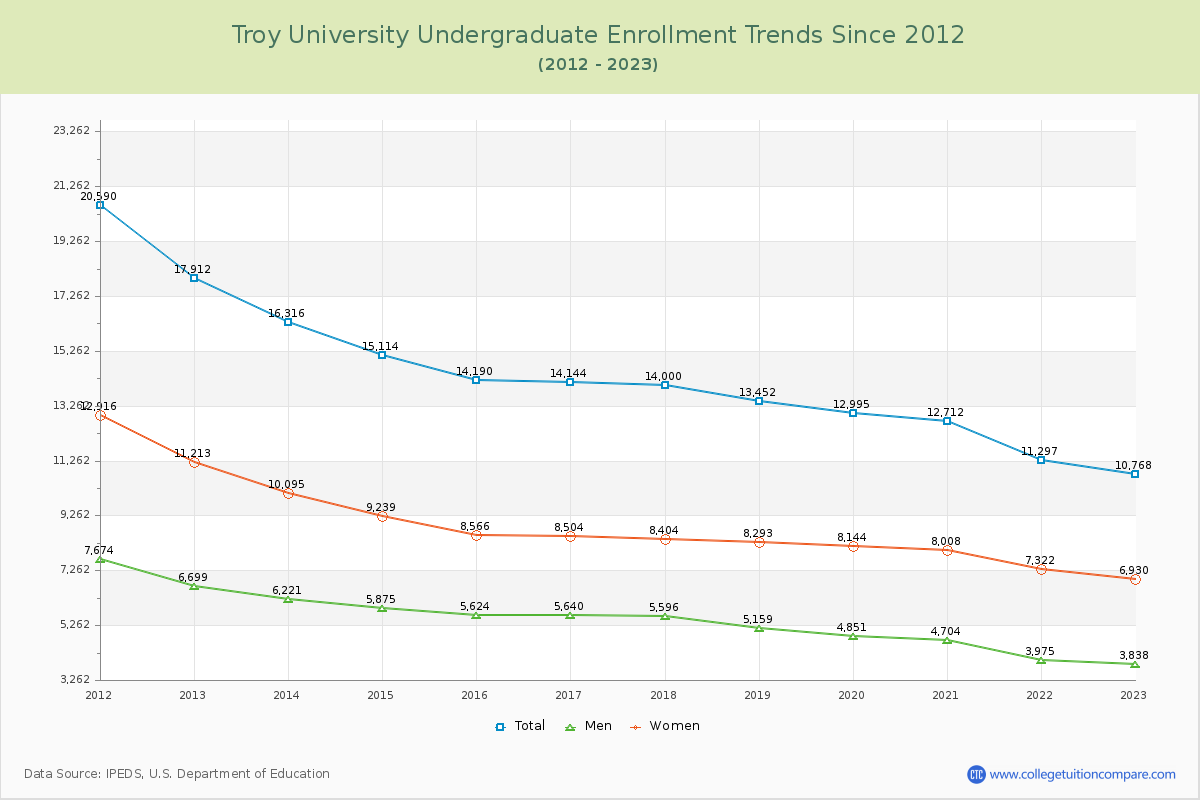
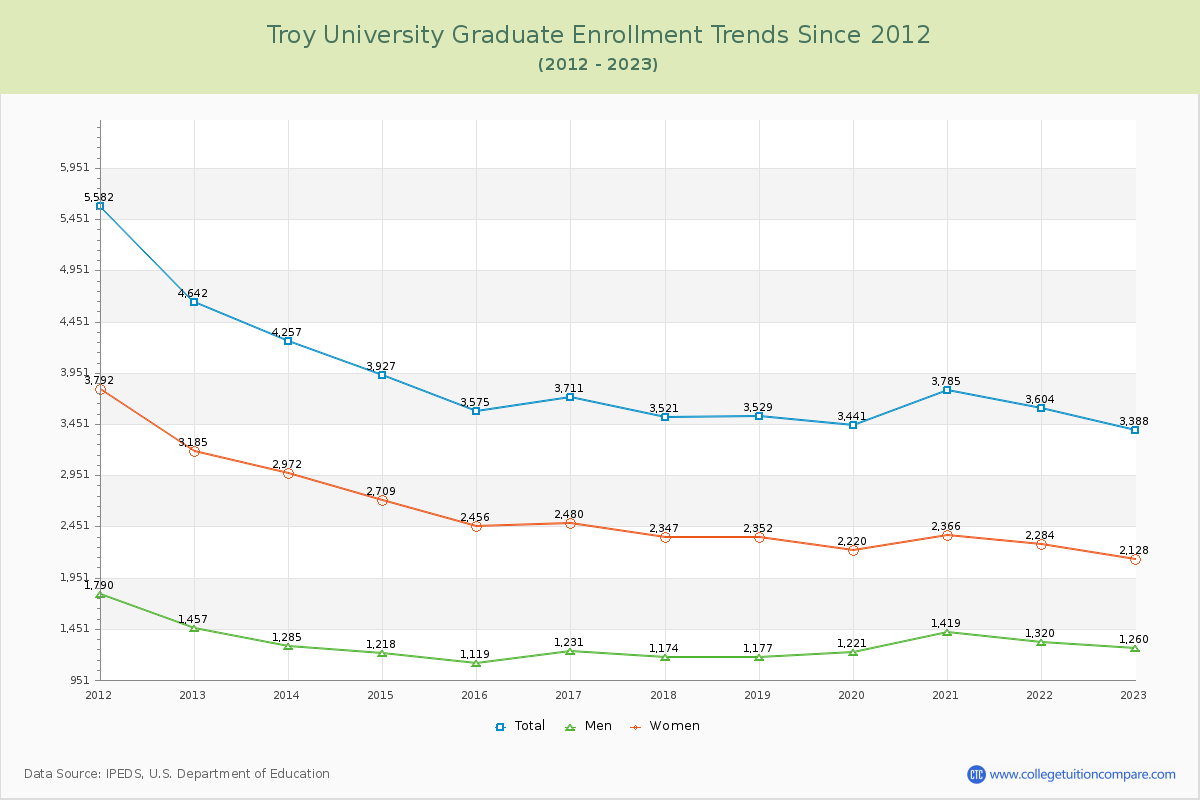
76.07% of total students is undergraduate students and 23.93% students is graduate students. The number of undergraduate students has decreased by 7,144 and the graduate enrollment has decreased by 1,254 over past 10 years.
The female to male ratio is 1.78 to 1 and it means that there are more female students enrolled in TROY than male students.
The following table and chart illustrate the changes in student population by gender at Troy University since 2012.
| Year | Total | Undergraduate | Graduate | ||||
|---|---|---|---|---|---|---|---|
| Total | Men | Women | Total | Men | Women | ||
| 2012-13 | 22,554 | 17,912 | 6,699 | 11,213 | 4,642 | 1,457 | 3,185 |
| 2013-14 | 20,573 -1,981 | 16,316 -1,596 | 6,221 -478 | 10,095 -1,118 | 4,257 -385 | 1,285 -172 | 2,972 -213 |
| 2014-15 | 19,041 -1,532 | 15,114 -1,202 | 5,875 -346 | 9,239 -856 | 3,927 -330 | 1,218 -67 | 2,709 -263 |
| 2015-16 | 17,765 -1,276 | 14,190 -924 | 5,624 -251 | 8,566 -673 | 3,575 -352 | 1,119 -99 | 2,456 -253 |
| 2016-17 | 17,855 90 | 14,144 -46 | 5,640 16 | 8,504 -62 | 3,711 136 | 1,231 112 | 2,480 24 |
| 2017-18 | 17,521 -334 | 14,000 -144 | 5,596 -44 | 8,404 -100 | 3,521 -190 | 1,174 -57 | 2,347 -133 |
| 2018-19 | 16,981 -540 | 13,452 -548 | 5,159 -437 | 8,293 -111 | 3,529 8 | 1,177 3 | 2,352 5 |
| 2019-20 | 16,436 -545 | 12,995 -457 | 4,851 -308 | 8,144 -149 | 3,441 -88 | 1,221 44 | 2,220 -132 |
| 2020-21 | 16,497 61 | 12,712 -283 | 4,704 -147 | 8,008 -136 | 3,785 344 | 1,419 198 | 2,366 146 |
| 2021-22 | 14,901 -1,596 | 11,297 -1,415 | 3,975 -729 | 7,322 -686 | 3,604 -181 | 1,320 -99 | 2,284 -82 |
| 2022-23 | 14,156 -745 | 10,768 -529 | 3,838 -137 | 6,930 -392 | 3,388 -216 | 1,260 -60 | 2,128 -156 |
| Average | 17,662 | 13,900 | 5,289 | 8,611 | 3,762 | 1,262 | 2,500 |