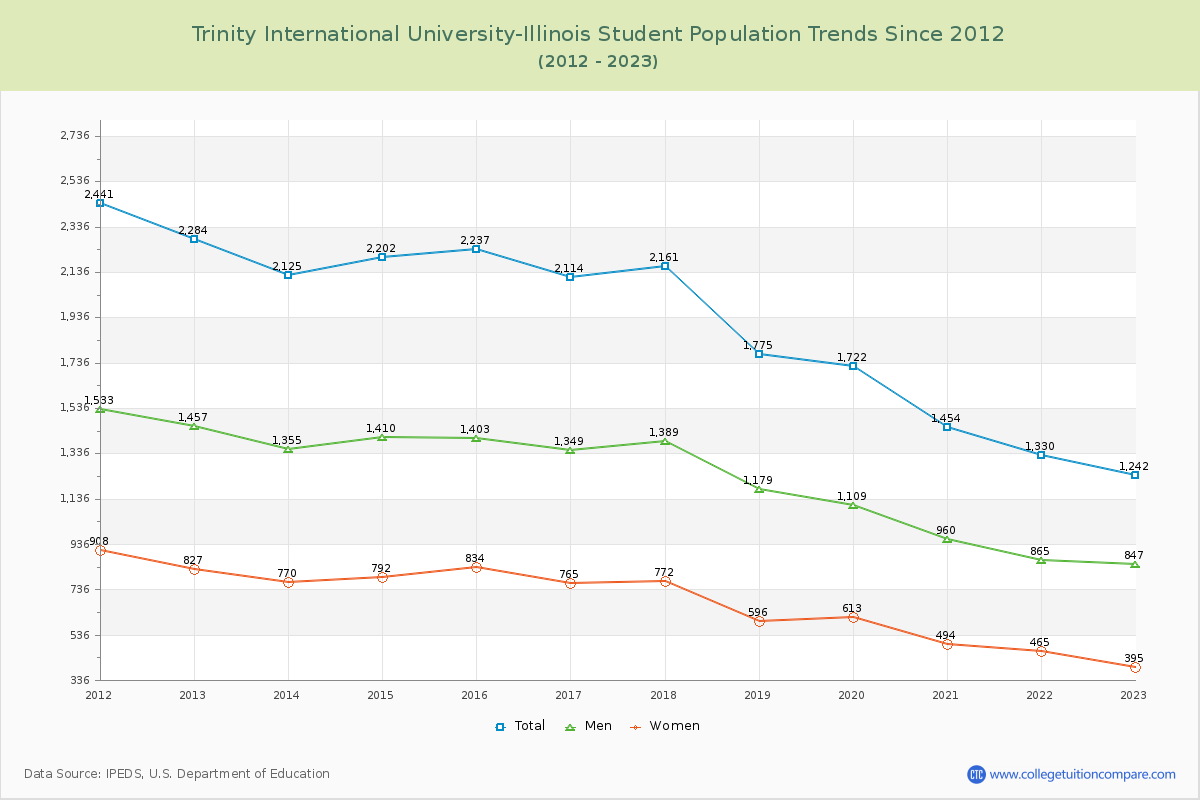
Student Population Changes
The average student population over the last 12 years is 1,877 where 1,242 students are attending the school for the academic year 2022-2023.
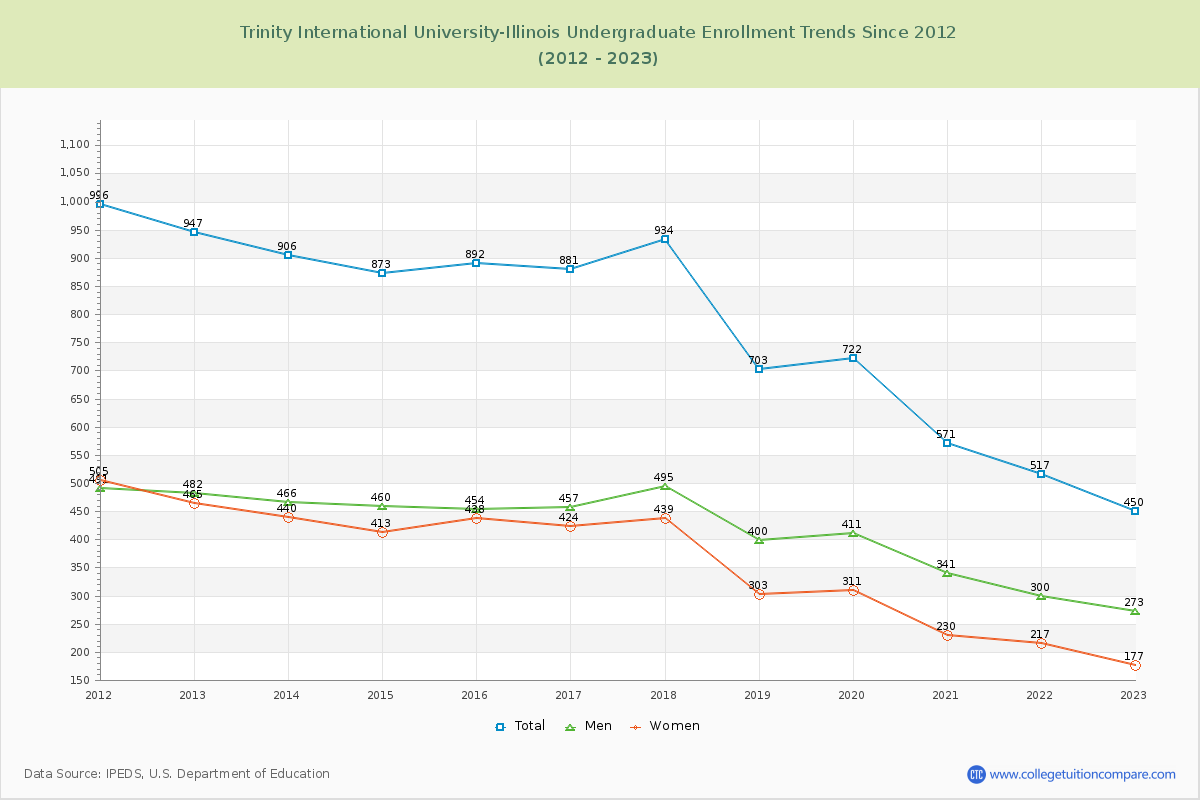
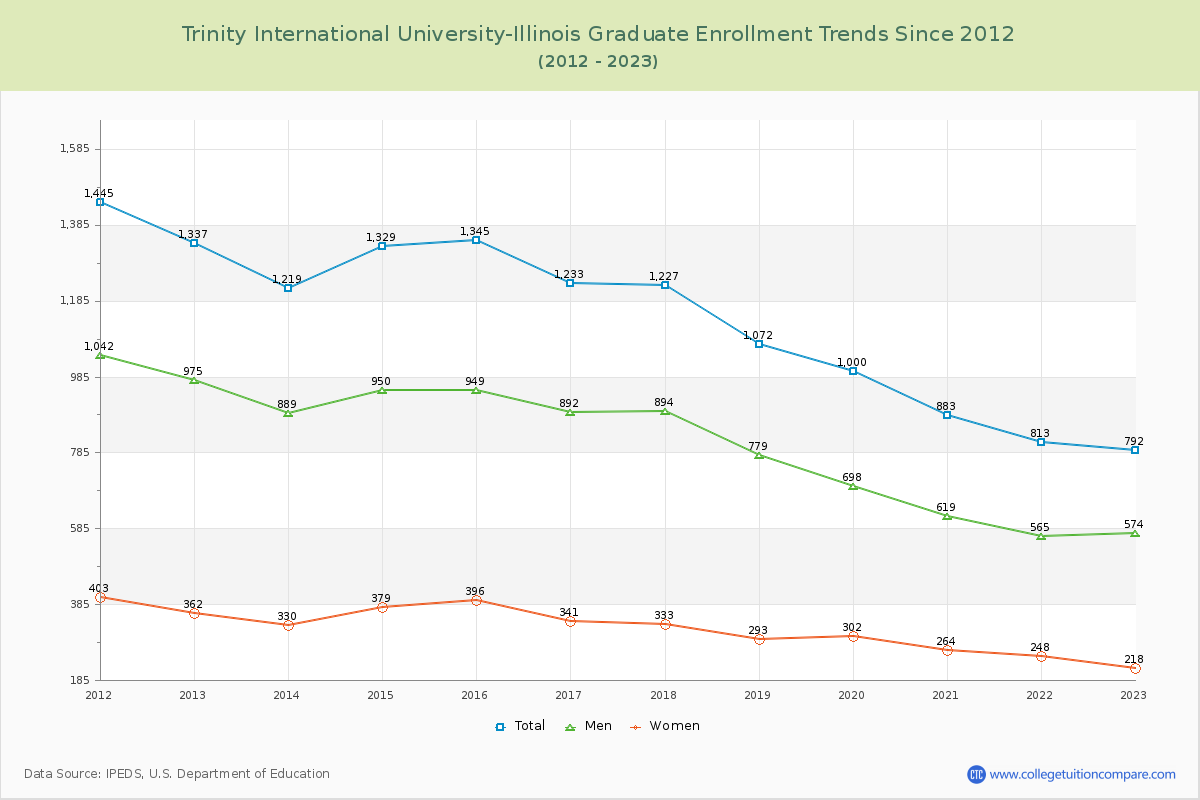
36.23% of total students is undergraduate students and 63.77% students is graduate students. The number of undergraduate students has decreased by 497 and the graduate enrollment has decreased by 545 over past 10 years.
The female to male ratio is 0.47 to 1 and it means that there are far more male students enrolled in Trinity International University-Illinois than female students.
The following table and chart illustrate the changes in student population by gender at Trinity International University-Illinois since 2012.
| Year | Total | Undergraduate | Graduate | ||||
|---|---|---|---|---|---|---|---|
| Total | Men | Women | Total | Men | Women | ||
| 2012-13 | 2,284 | 947 | 482 | 465 | 1,337 | 975 | 362 |
| 2013-14 | 2,125 -159 | 906 -41 | 466 -16 | 440 -25 | 1,219 -118 | 889 -86 | 330 -32 |
| 2014-15 | 2,202 77 | 873 -33 | 460 -6 | 413 -27 | 1,329 110 | 950 61 | 379 49 |
| 2015-16 | 2,237 35 | 892 19 | 454 -6 | 438 25 | 1,345 16 | 949 -1 | 396 17 |
| 2016-17 | 2,114 -123 | 881 -11 | 457 3 | 424 -14 | 1,233 -112 | 892 -57 | 341 -55 |
| 2017-18 | 2,161 47 | 934 53 | 495 38 | 439 15 | 1,227 -6 | 894 2 | 333 -8 |
| 2018-19 | 1,775 -386 | 703 -231 | 400 -95 | 303 -136 | 1,072 -155 | 779 -115 | 293 -40 |
| 2019-20 | 1,722 -53 | 722 19 | 411 11 | 311 8 | 1,000 -72 | 698 -81 | 302 9 |
| 2020-21 | 1,454 -268 | 571 -151 | 341 -70 | 230 -81 | 883 -117 | 619 -79 | 264 -38 |
| 2021-22 | 1,330 -124 | 517 -54 | 300 -41 | 217 -13 | 813 -70 | 565 -54 | 248 -16 |
| 2022-23 | 1,242 -88 | 450 -67 | 273 -27 | 177 -40 | 792 -21 | 574 9 | 218 -30 |
| Average | 1,877 | 763 | 413 | 351 | 1,114 | 799 | 315 |