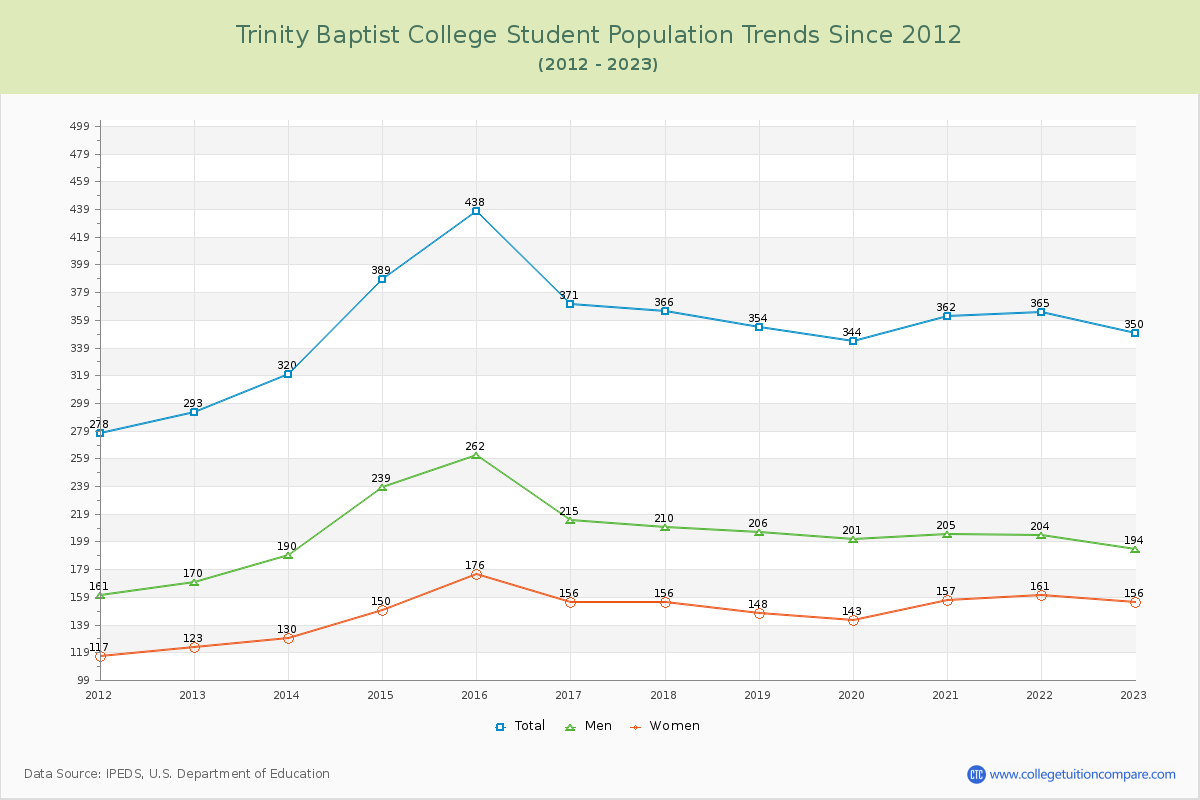
Student Population Changes
The average student population over the last 12 years is 359 where 350 students are attending the school for the academic year 2022-2023.
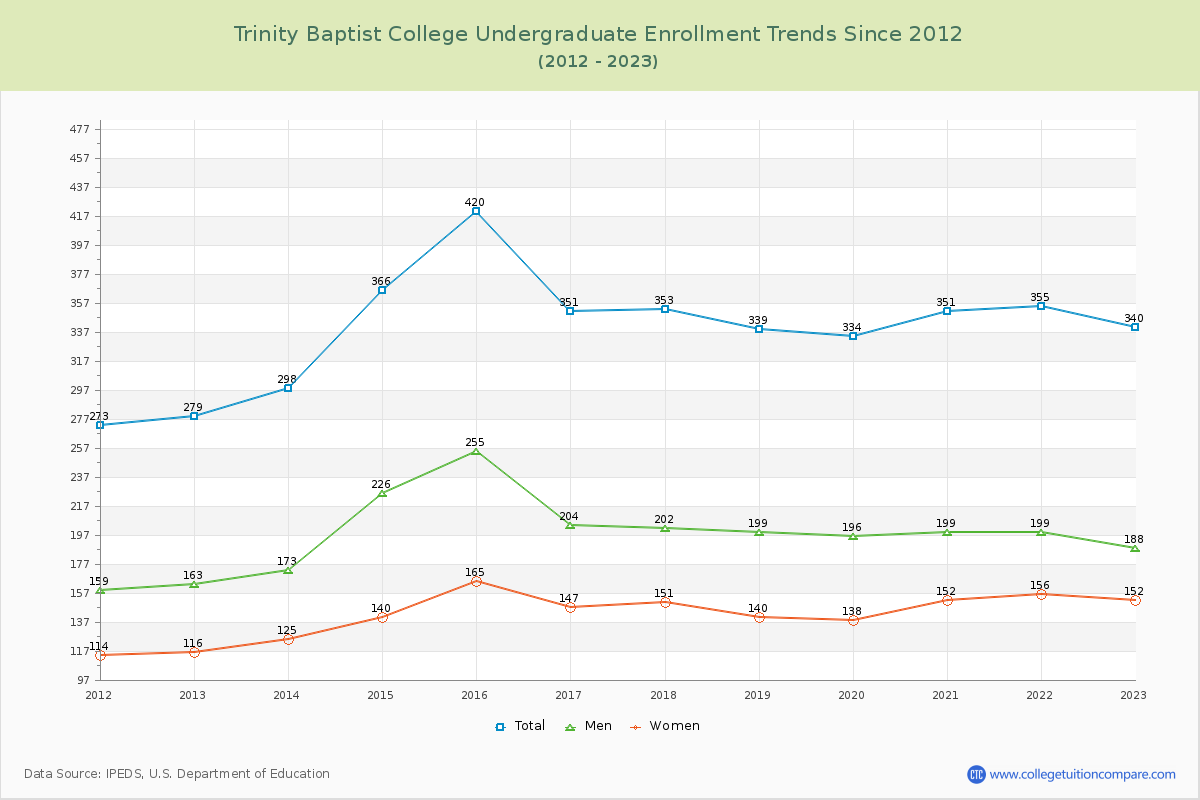
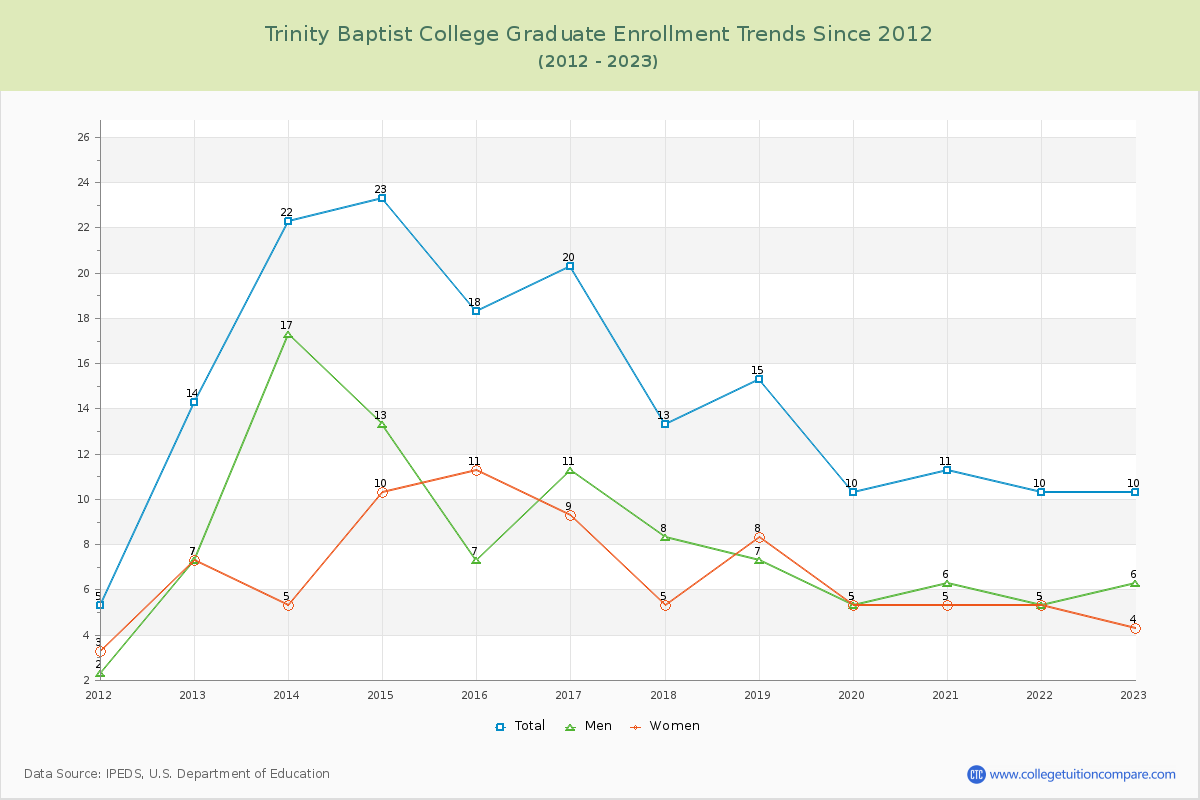
97.14% of total students is undergraduate students and 2.86% students is graduate students. The number of undergraduate students has increased by 61 and the graduate enrollment has decreased by 4 over past 10 years.
The female to male ratio is 0.80 to 1 and it means that there are more male students enrolled in Trinity Baptist than female students.
The following table and chart illustrate the changes in student population by gender at Trinity Baptist College since 2012.
| Year | Total | Undergraduate | Graduate | ||||
|---|---|---|---|---|---|---|---|
| Total | Men | Women | Total | Men | Women | ||
| 2012-13 | 293 | 279 | 163 | 116 | 14 | 7 | 7 |
| 2013-14 | 320 27 | 298 19 | 173 10 | 125 9 | 22 8 | 17 10 | 5 -2 |
| 2014-15 | 389 69 | 366 68 | 226 53 | 140 15 | 23 1 | 13 -4 | 10 5 |
| 2015-16 | 438 49 | 420 54 | 255 29 | 165 25 | 18 -5 | 7 -6 | 11 1 |
| 2016-17 | 371 -67 | 351 -69 | 204 -51 | 147 -18 | 20 2 | 11 4 | 9 -2 |
| 2017-18 | 366 -5 | 353 2 | 202 -2 | 151 4 | 13 -7 | 8 -3 | 5 -4 |
| 2018-19 | 354 -12 | 339 -14 | 199 -3 | 140 -11 | 15 2 | 7 -1 | 8 3 |
| 2019-20 | 344 -10 | 334 -5 | 196 -3 | 138 -2 | 10 -5 | 5 -2 | 5 -3 |
| 2020-21 | 362 18 | 351 17 | 199 3 | 152 14 | 11 1 | 6 1 | 5 0 |
| 2021-22 | 365 3 | 355 4 | 199 0 | 156 4 | 10 -1 | 5 -1 | 5 0 |
| 2022-23 | 350 -15 | 340 -15 | 188 -11 | 152 -4 | 10 0 | 6 1 | 4 -1 |
| Average | 359 | 344 | 200 | 144 | 15 | 8 | 7 |