Enrollment Trends at RFD

36

Total Enrollment

5

Men

31

Women

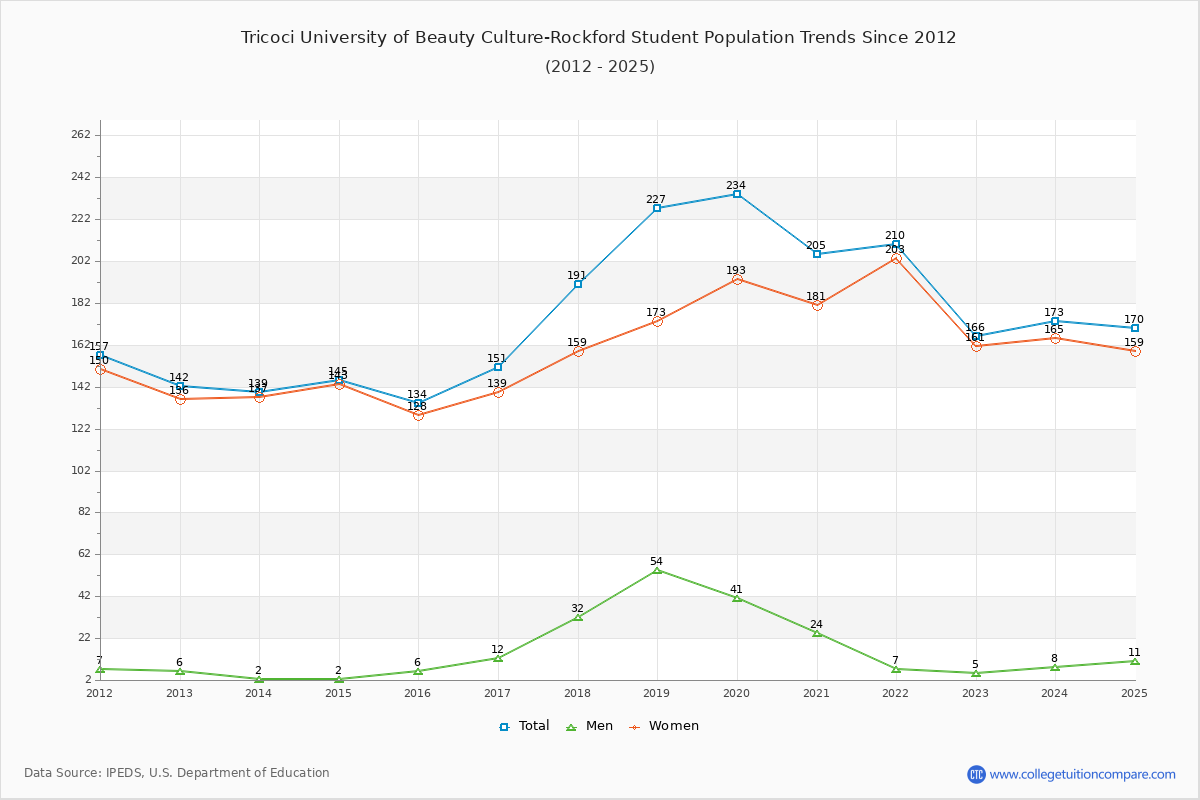
The student population at Tricoci University of Beauty Culture-Rockford is 170 (all undergraduate). The number of students has increased by 36 over the past decade.

The female to male ratio is 14.45 to 1 which means that majority of population is on female students.

All students have enrolled in on-campus classes (Tricoci University of Beauty Culture-Rockford does not offer online degree/certificate program).

Student Population Changes

The average student population over the last 11 years is 186 where 170 students are attending the school for the academic year 2024-2025.

The female to male ratio is 14.45 to 1 and it means that there are far more female students enrolled in RFD than male students.

The following table and chart illustrate the changes in student population by gender at Tricoci University of Beauty Culture-Rockford since 2015.

YearTotalMenWomen
2015-161346128
2016-17151
17
12
6
139
11
2017-18191
40
32
20
159
20
2018-19227
36
54
22
173
14
2019-20234
7
41
-13
193
20
2020-21205
-29
24
-17
181
-12
2021-22210
5
7
-17
203
22
2022-23166
-44
5
-2
161
-42
2023-24173
7
8
3
165
4
2024-25170
-3
11
3
159
-6
Average18620166
Tricoci University of Beauty Culture-Rockford Enrollment Trends Chart

Enrollment by Race/Ethnicity Changes

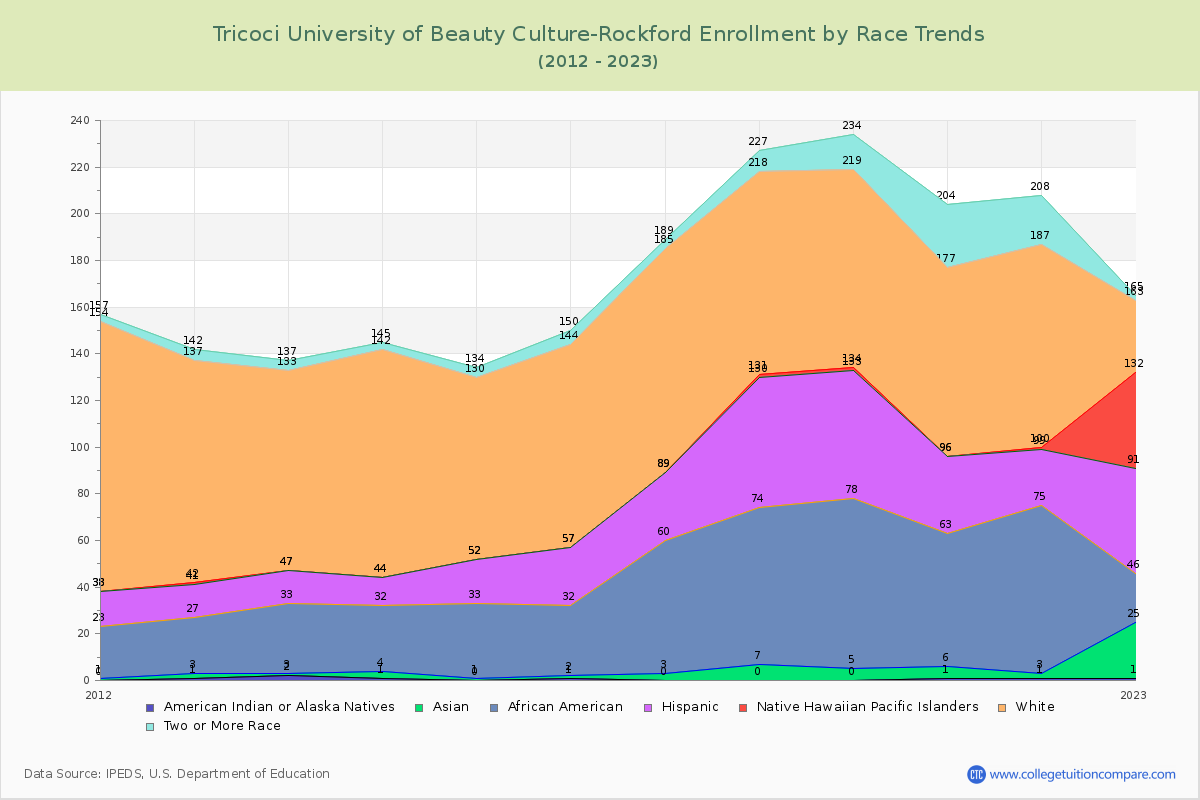
The percentage of white students is 28.82% and the percentage of black students is 34.12% at Tricoci University of Beauty Culture-Rockford. 2.35% of enrolled students is Asian. Hispanic students comprise 25.29% of the student body.

Over the past 10 years, the racial composition has shifted. The percentage of white students decreased from 58.21% to 28.82%. Asian enrollment grew from 0.75% to 2.35%. Black student enrollment increased from 23.88% to 34.12%. Hispanic student representation expanded from 14.18% to 25.29%.

The overall racial diversity, measured by the Census Bureau Diversity Index, is 0.7271 which indicates that quite diverse. This increased from 0.5831 a decade ago, suggesting that racial diversity has improved.

The following table and chart illustrate the student population trends by race/ethnicity at Tricoci University of Beauty Culture-Rockford over the past 11 years (2015-2025).

YearAmerican Indian or Native AmericanAsianBlackHispanicNative Hawaiian or Other Pacific IslanderWhiteTwo or More Races
2015-160132190784
2016-171130250876
2017-180357290964
2018-190767561879
2019-2005735518515
2020-2115573308127
2021-2212722418721
2022-23124214541312
2023-2400604105913
2024-2504584304916
Average05533747412
Tricoci University of Beauty Culture-Rockford Enrollment by Race Trends Chart

Distance Learning (Online Courses) Enrollment Changes

Tricoci University of Beauty Culture-Rockford does not offer online degree/certificate programs. All Students have enrolled in on-campus programs.


Ratings & Review

Share your experiences and thoughts about Tricoci University of Beauty Culture-Rockford. It will be a great help to applicants and prospective students!