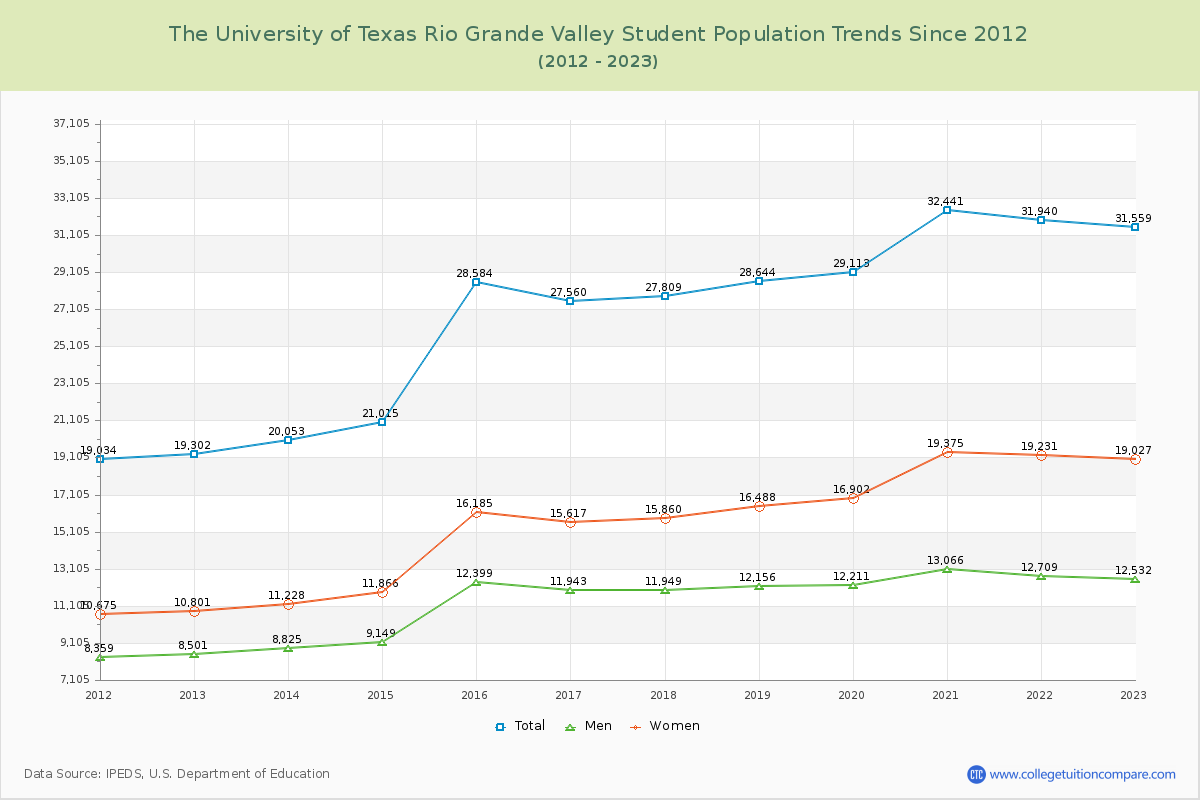
Student Population Changes
The average student population over the last 12 years is 27,093 where 31,559 students are attending the school for the academic year 2022-2023.
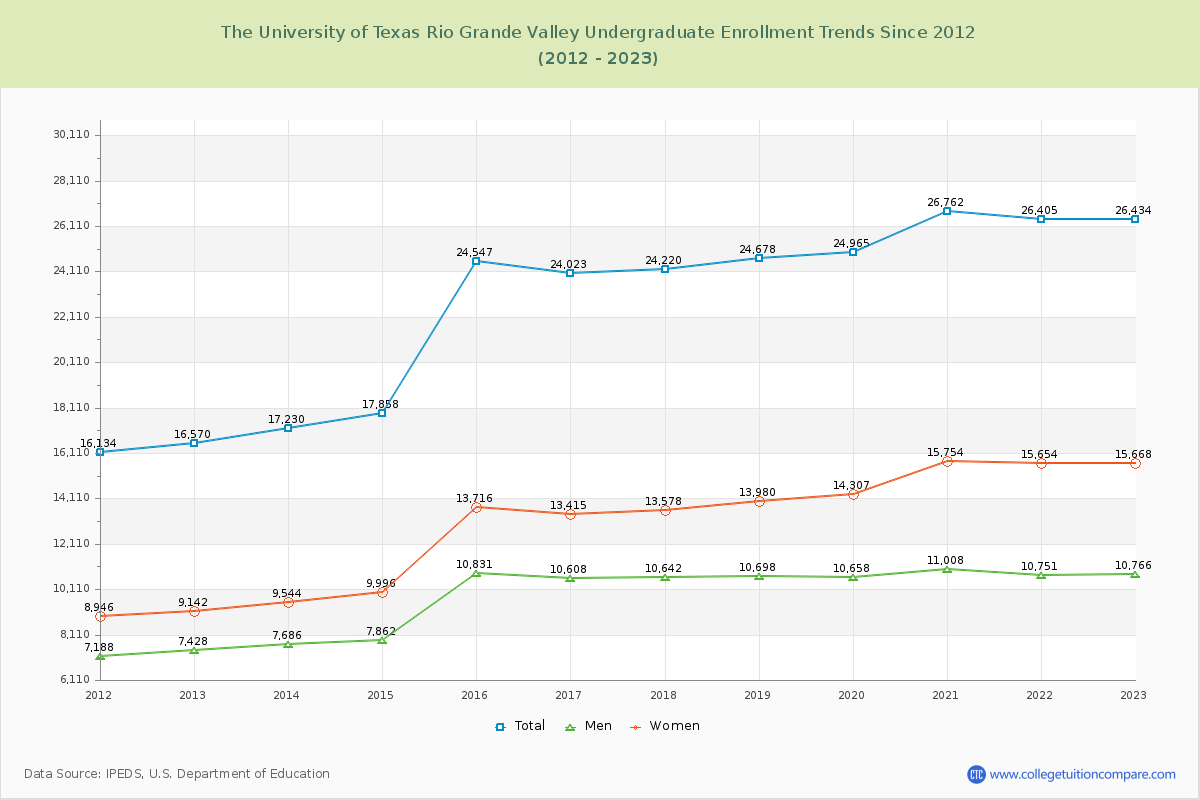
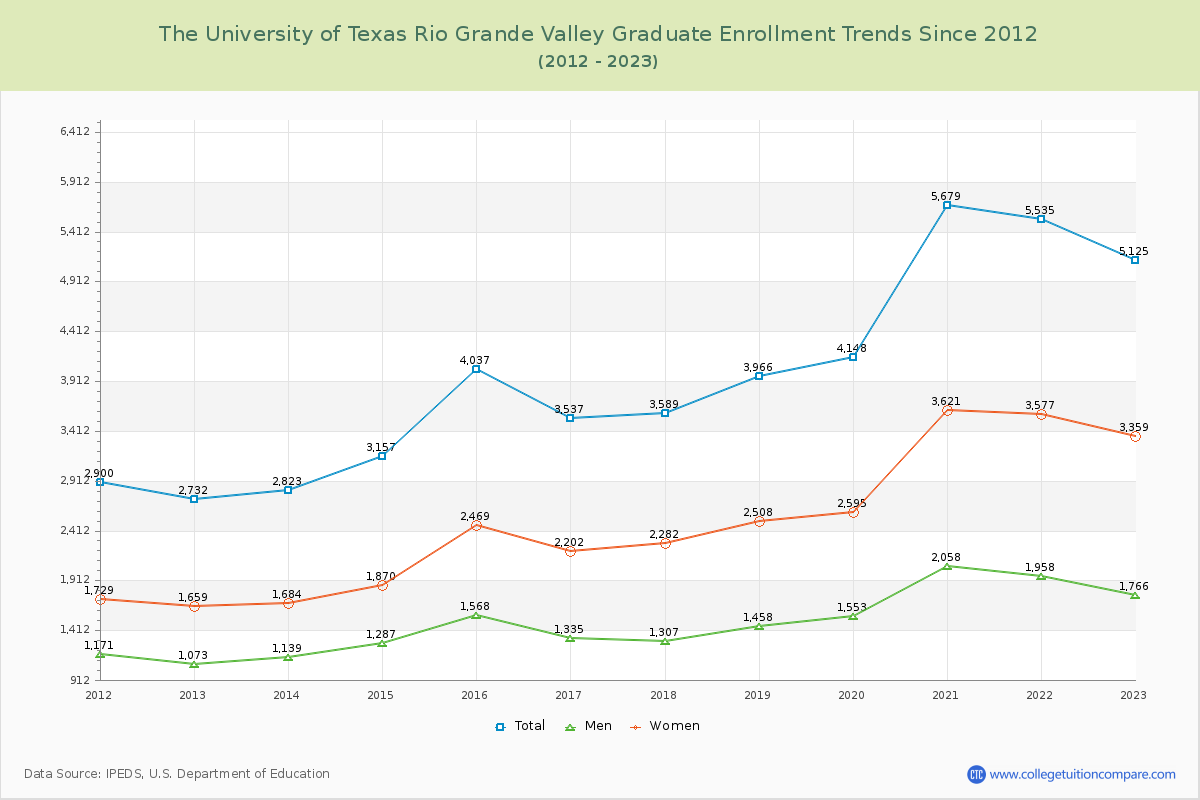
83.76% of total students is undergraduate students and 16.24% students is graduate students. The number of undergraduate students has increased by 9,864 and the graduate enrollment has increased by 2,393 over past 10 years.
The female to male ratio is 1.52 to 1 and it means that there are more female students enrolled in UTRGV than male students.
The following table and chart illustrate the changes in student population by gender at The University of Texas Rio Grande Valley since 2012.
| Year | Total | Undergraduate | Graduate | ||||
|---|---|---|---|---|---|---|---|
| Total | Men | Women | Total | Men | Women | ||
| 2012-13 | 19,302 | 16,570 | 7,428 | 9,142 | 2,732 | 1,073 | 1,659 |
| 2013-14 | 20,053 751 | 17,230 660 | 7,686 258 | 9,544 402 | 2,823 91 | 1,139 66 | 1,684 25 |
| 2014-15 | 21,015 962 | 17,858 628 | 7,862 176 | 9,996 452 | 3,157 334 | 1,287 148 | 1,870 186 |
| 2015-16 | 28,584 7,569 | 24,547 6,689 | 10,831 2,969 | 13,716 3,720 | 4,037 880 | 1,568 281 | 2,469 599 |
| 2016-17 | 27,560 -1,024 | 24,023 -524 | 10,608 -223 | 13,415 -301 | 3,537 -500 | 1,335 -233 | 2,202 -267 |
| 2017-18 | 27,809 249 | 24,220 197 | 10,642 34 | 13,578 163 | 3,589 52 | 1,307 -28 | 2,282 80 |
| 2018-19 | 28,644 835 | 24,678 458 | 10,698 56 | 13,980 402 | 3,966 377 | 1,458 151 | 2,508 226 |
| 2019-20 | 29,113 469 | 24,965 287 | 10,658 -40 | 14,307 327 | 4,148 182 | 1,553 95 | 2,595 87 |
| 2020-21 | 32,441 3,328 | 26,762 1,797 | 11,008 350 | 15,754 1,447 | 5,679 1,531 | 2,058 505 | 3,621 1,026 |
| 2021-22 | 31,940 -501 | 26,405 -357 | 10,751 -257 | 15,654 -100 | 5,535 -144 | 1,958 -100 | 3,577 -44 |
| 2022-23 | 31,559 -381 | 26,434 29 | 10,766 15 | 15,668 14 | 5,125 -410 | 1,766 -192 | 3,359 -218 |
| Average | 27,093 | 23,063 | 9,903 | 13,159 | 4,030 | 1,500 | 2,530 |