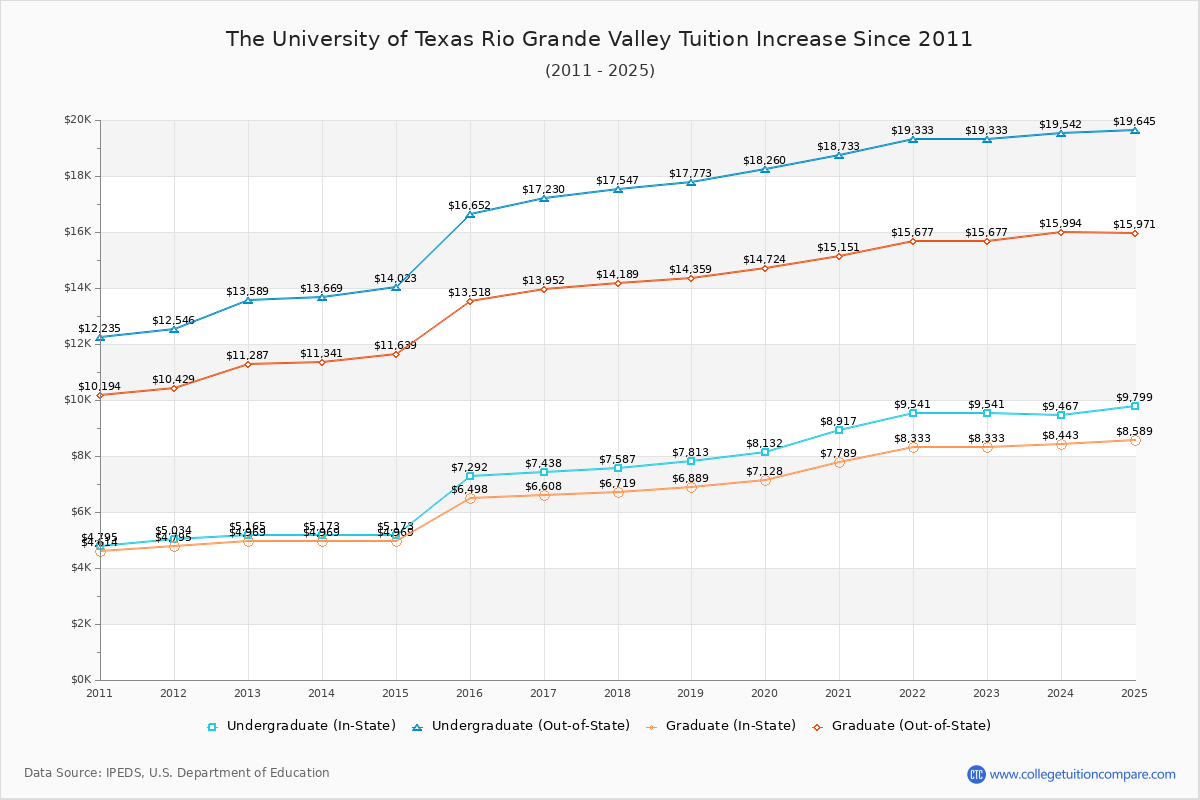
UTRGV's tuition & fees has increased from $16,652 (2015) to $19,645 (2025), and the rate of tuition increase is 17.97% over the past 10 years. The graduate school tuition & fees has raised from $13,518 (year 2015) to $15,971 (year 2025).
The 2025 tuition & fees are lower than last year (2024) at The University of Texas Rio Grande Valley.
UTRGV's tuition increase rate is higher than the Texas's average increase rate of 5.09%. Compare to all colleges in United States, it's increase rate is higher than the average increase rate of 10.99%.
Cost of Attendance (COA) Trends
The total cost of attendance (COA), including tuition & fees, books & supplies costs, and living costs, increased by 20.52% from 2015 ($28,660).
For the current academic year 2024-2025, UTRGV's COA is $34,541, which is decreased by -0.05% from last year.
The following table and chart show changes to UTRGV's COA over the past 10 years.
Tuition & Fees Changes
The tuition & fees have increased 17.97% for the last 10 years , and the 2025 tuition & fees are $17,682. The following table and chart show the tuition & fees changes at The University of Texas Rio Grande Valley over last the 10 years.
Books & Supplies Costs Changes
The cost of purchasing books & supplies which are required/recommended for courses $1,250, and it has increased 4.69% from the year 2015 to 2025.
| Year | Books & Supplies | Change by Year |
| 2015-16 | $1,194 | - |
|---|
| 2016-17 | $1,210 | 1.34% |
|---|
| 2017-18 | $1,210 | |
|---|
| 2018-19 | $1,218 | 0.66% |
|---|
| 2019-20 | $1,238 | 1.64% |
|---|
| 2020-21 | $1,240 | 0.16% |
|---|
| 2021-22 | $1,240 | |
|---|
| 2022-23 | $1,196 | -3.55% |
|---|
| 2023-24 | $1,190 | -0.50% |
|---|
| 2024-25 | $1,250 | 5.04% |
|---|
Living Costs Changes
The living costs including room, board, and other living expenses have increased 18.15% when a student lives on-campus facilities and 26.58% when living-off campus from the year 2015 to 2025. The following table shows the changes in living costs at The University of Texas Rio Grande Valley.
| Year | Living On Campus | Living Off Campus | Change by Year |
| 2015-16 | $10,814 | $12,168 | - |
|---|
| 2016-17 | $11,102 | $11,840 | 2.66% |
|---|
| 2017-18 | $11,238 | $12,186 | 1.23% |
|---|
| 2018-19 | $11,440 | $12,552 | 1.80% |
|---|
| 2019-20 | $11,576 | $12,598 | 1.19% |
|---|
| 2020-21 | $11,552 | $12,646 | -0.21% |
|---|
| 2021-22 | $11,597 | $12,782 | 0.39% |
|---|
| 2022-23 | $12,508 | $13,878 | 7.86% |
|---|
| 2023-24 | $13,428 | $15,060 | 7.36% |
|---|
| 2024-25 | $13,646 | $15,793 | 1.62% |
|---|
Compare Tuition Change to Similar Colleges
The following table compares 2025 tuition and increase rate from last year between The University of Texas Rio Grande Valley and similar schools.
| 2025 | 2024 | Increase Rate |
| The University of Texas Rio Grande Valley | $19,645 ($9,799) | $19,542 ($9,467) | 0.53% |
|---|
|
| Chicago State University | $12,757 ($12,757) | $12,754 ($12,754) | 0.02% |
|---|
|
| New Mexico State University-Main Campus | $25,307 ($8,183) | $25,271 ($8,147) | 0.14% |
|---|
|
| Utah Valley University | $18,489 ($6,507) | $17,830 ($6,270) | 3.70% |
|---|
|
| California Baptist University | $41,228 ($32,256) | $39,720 ($32,256) | 3.80% |
|---|
|
| California State University-Bakersfield | $20,687 ($8,087) | $19,576 ($7,696) | 5.68% |
|---|