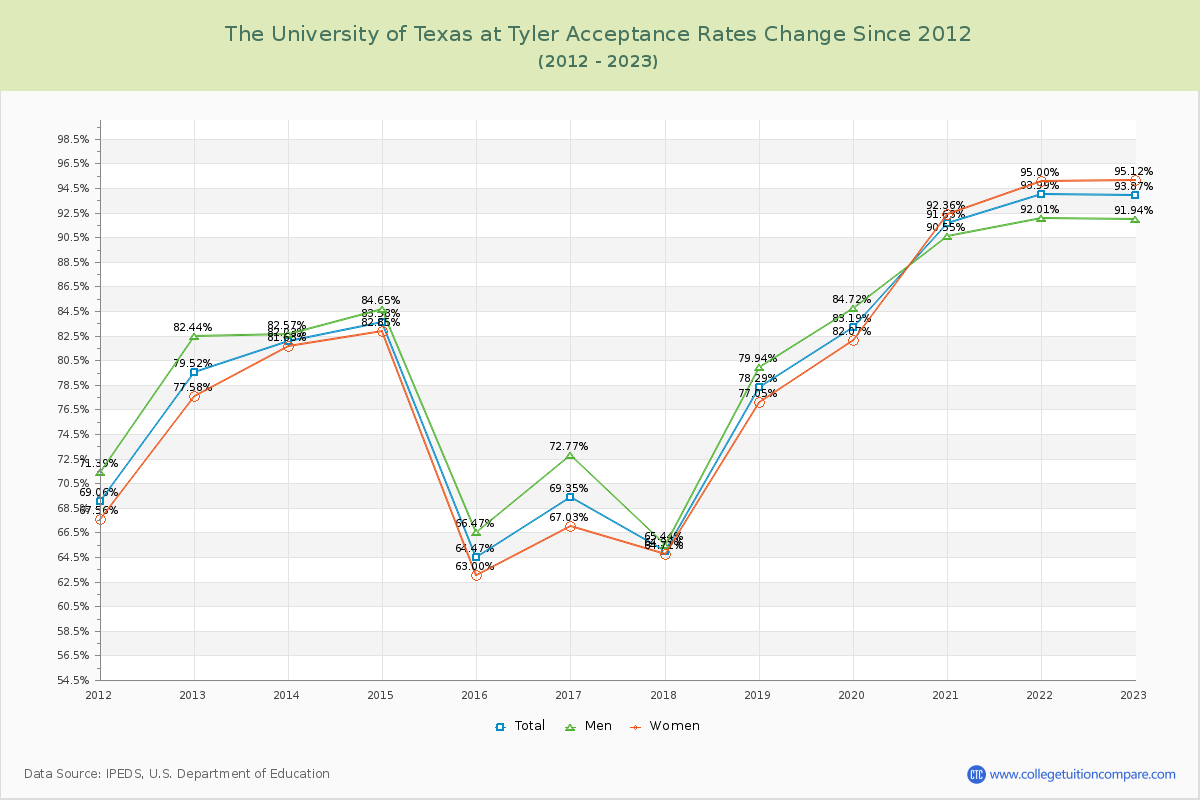
Acceptance Rate Changes
The average acceptance rate over the last 10 years is 80.45%, and this year's acceptance rate is 93.87% at The University of Texas at Tyler. By gender, men students' acceptance rate is 81.23% and women students' rate is 79.85%.
The next table and chart illustrate the acceptance rates changes at The University of Texas at Tyler over the past 11 years (2012-2023).
| Year | Total | Men | Women |
|---|---|---|---|
| 2012-13 | 79.52% | 82.44% | 77.58% |
| 2013-14 | 82.03% 2.51% |
82.57% 4.04% |
81.63% 4.04% |
| 2014-15 | 83.58% 1.55% |
84.65% 1.22% |
82.85% 1.22% |
| 2015-16 | 64.47% -19.12% |
66.47% -19.85% |
63.00% -19.85% |
| 2016-17 | 69.35% 4.88% |
72.77% 4.03% |
67.03% 4.03% |
| 2017-18 | 64.99% -4.35% |
65.44% -2.32% |
64.71% -2.32% |
| 2018-19 | 78.29% 13.30% |
79.94% 12.34% |
77.05% 12.34% |
| 2019-20 | 83.19% 4.90% |
84.72% 5.03% |
82.07% 5.03% |
| 2020-21 | 91.63% 8.44% |
90.55% 10.29% |
92.36% 10.29% |
| 2021-22 | 93.99% 2.36% |
92.01% 2.64% |
95.00% 2.64% |
| 2022-23 | 93.87% -0.12% |
91.94% 0.12% |
95.12% 0.12% |
| Average | 80.45% | 81.23% | 79.85% |