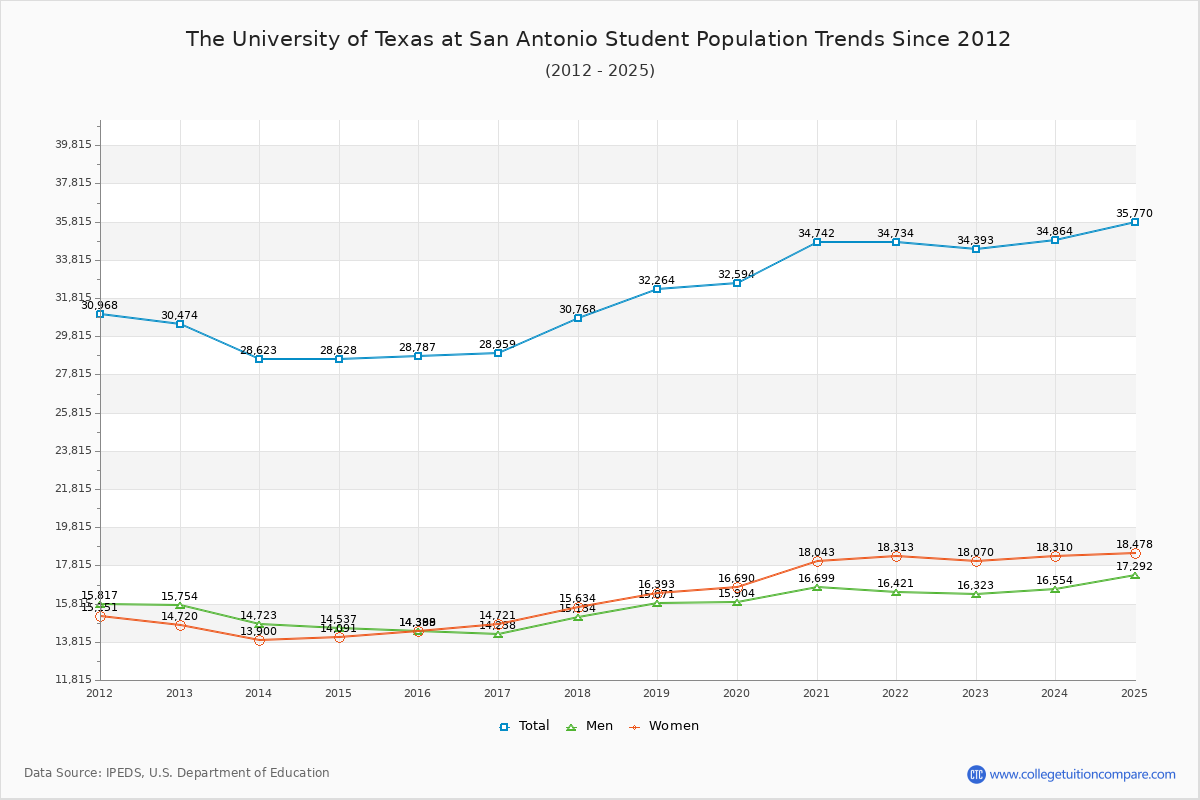
Student Population Changes
The average student population over the last 12 years is 31,361 where 34,393 students are attending the school for the academic year 2022-2023.
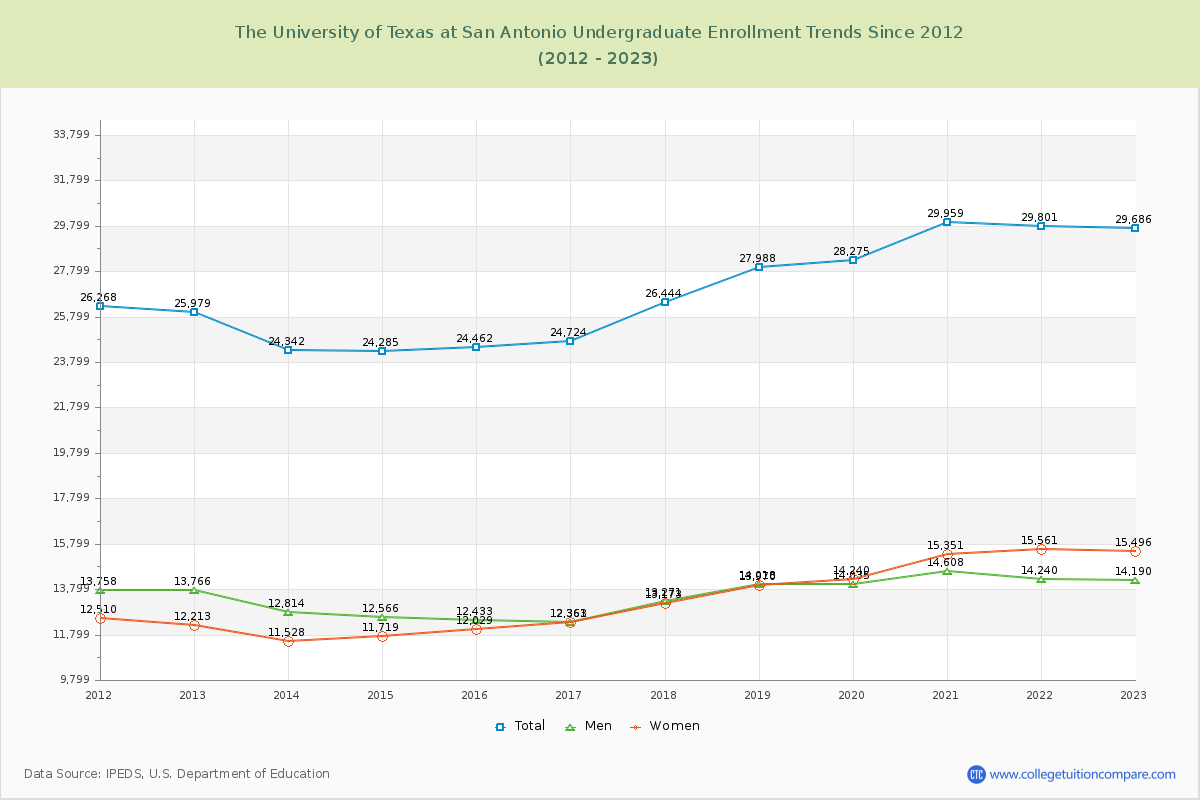
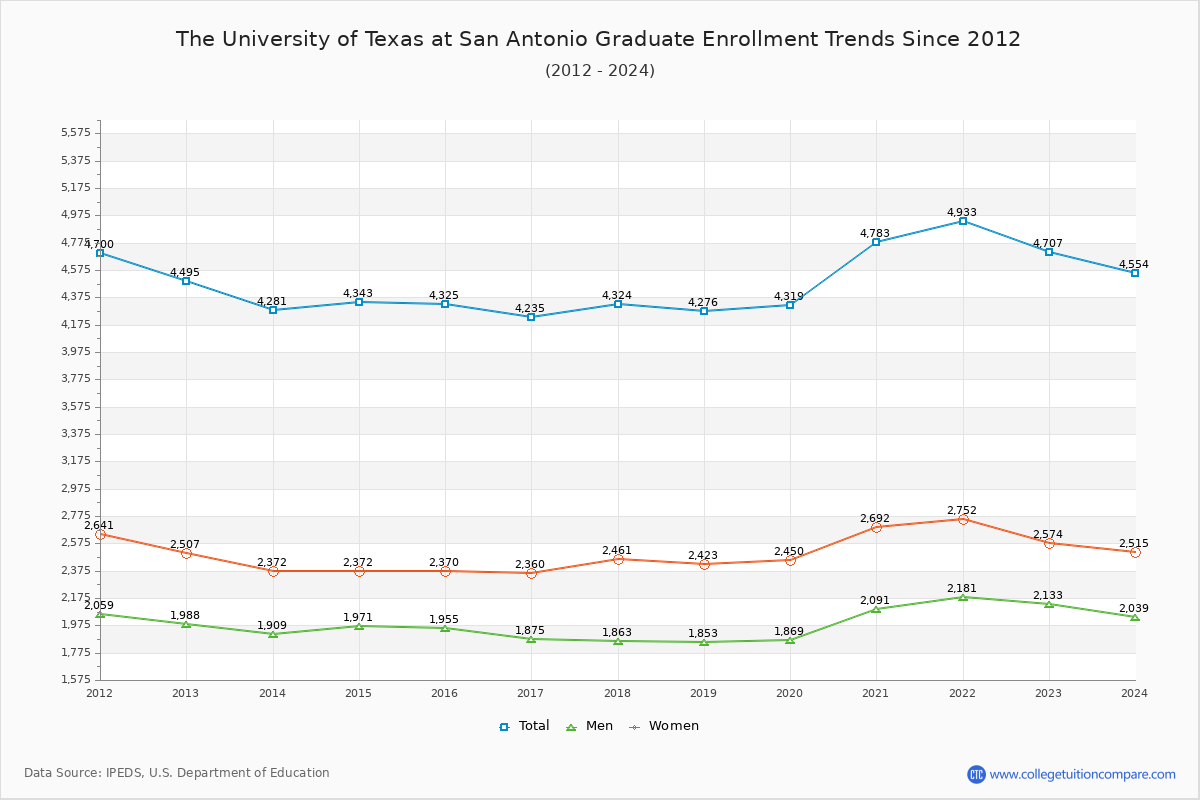
86.31% of total students is undergraduate students and 13.69% students is graduate students. The number of undergraduate students has increased by 3,707 and the graduate enrollment has increased by 212 over past 10 years.
The female to male ratio is 1.11 to 1 and it means that there are slightly more female students enrolled in UTSA than male students.
The following table and chart illustrate the changes in student population by gender at The University of Texas at San Antonio since 2012.
| Year | Total | Undergraduate | Graduate | ||||
|---|---|---|---|---|---|---|---|
| Total | Men | Women | Total | Men | Women | ||
| 2012-13 | 30,474 | 25,979 | 13,766 | 12,213 | 4,495 | 1,988 | 2,507 |
| 2013-14 | 28,623 -1,851 | 24,342 -1,637 | 12,814 -952 | 11,528 -685 | 4,281 -214 | 1,909 -79 | 2,372 -135 |
| 2014-15 | 28,628 5 | 24,285 -57 | 12,566 -248 | 11,719 191 | 4,343 62 | 1,971 62 | 2,372 0 |
| 2015-16 | 28,787 159 | 24,462 177 | 12,433 -133 | 12,029 310 | 4,325 -18 | 1,955 -16 | 2,370 -2 |
| 2016-17 | 28,959 172 | 24,724 262 | 12,363 -70 | 12,361 332 | 4,235 -90 | 1,875 -80 | 2,360 -10 |
| 2017-18 | 30,768 1,809 | 26,444 1,720 | 13,271 908 | 13,173 812 | 4,324 89 | 1,863 -12 | 2,461 101 |
| 2018-19 | 32,264 1,496 | 27,988 1,544 | 14,018 747 | 13,970 797 | 4,276 -48 | 1,853 -10 | 2,423 -38 |
| 2019-20 | 32,594 330 | 28,275 287 | 14,035 17 | 14,240 270 | 4,319 43 | 1,869 16 | 2,450 27 |
| 2020-21 | 34,742 2,148 | 29,959 1,684 | 14,608 573 | 15,351 1,111 | 4,783 464 | 2,091 222 | 2,692 242 |
| 2021-22 | 34,734 -8 | 29,801 -158 | 14,240 -368 | 15,561 210 | 4,933 150 | 2,181 90 | 2,752 60 |
| 2022-23 | 34,393 -341 | 29,686 -115 | 14,190 -50 | 15,496 -65 | 4,707 -226 | 2,133 -48 | 2,574 -178 |
| Average | 31,361 | 26,904 | 13,482 | 13,422 | 4,456 | 1,972 | 2,485 |