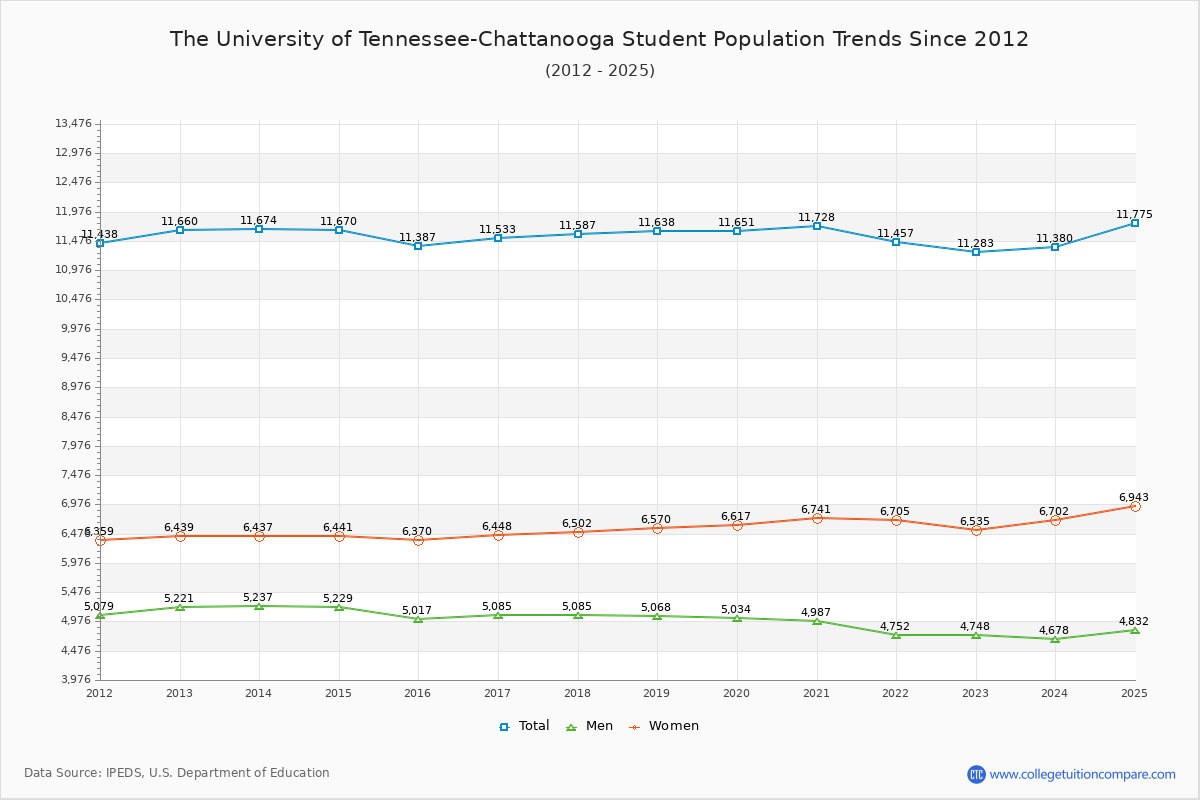
Student Population Changes
The average student population over the last 12 years is 11,570 where 11,283 students are attending the school for the academic year 2022-2023.
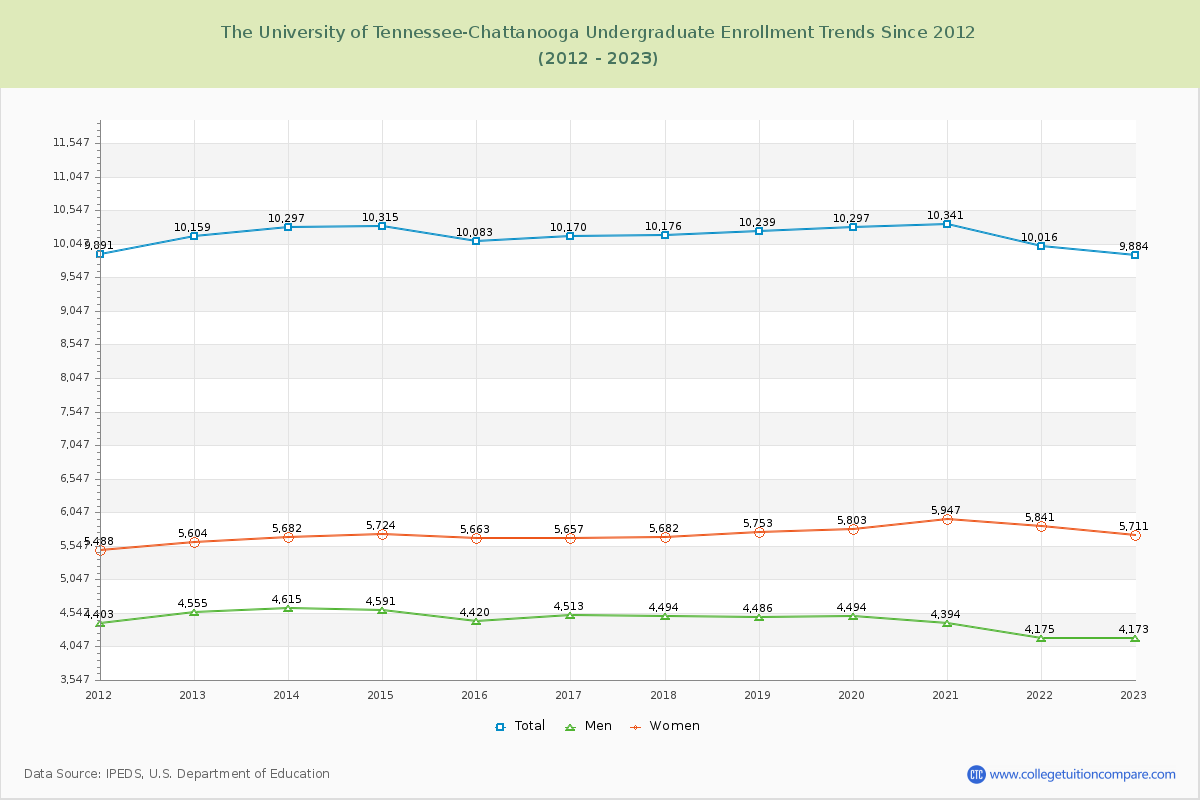
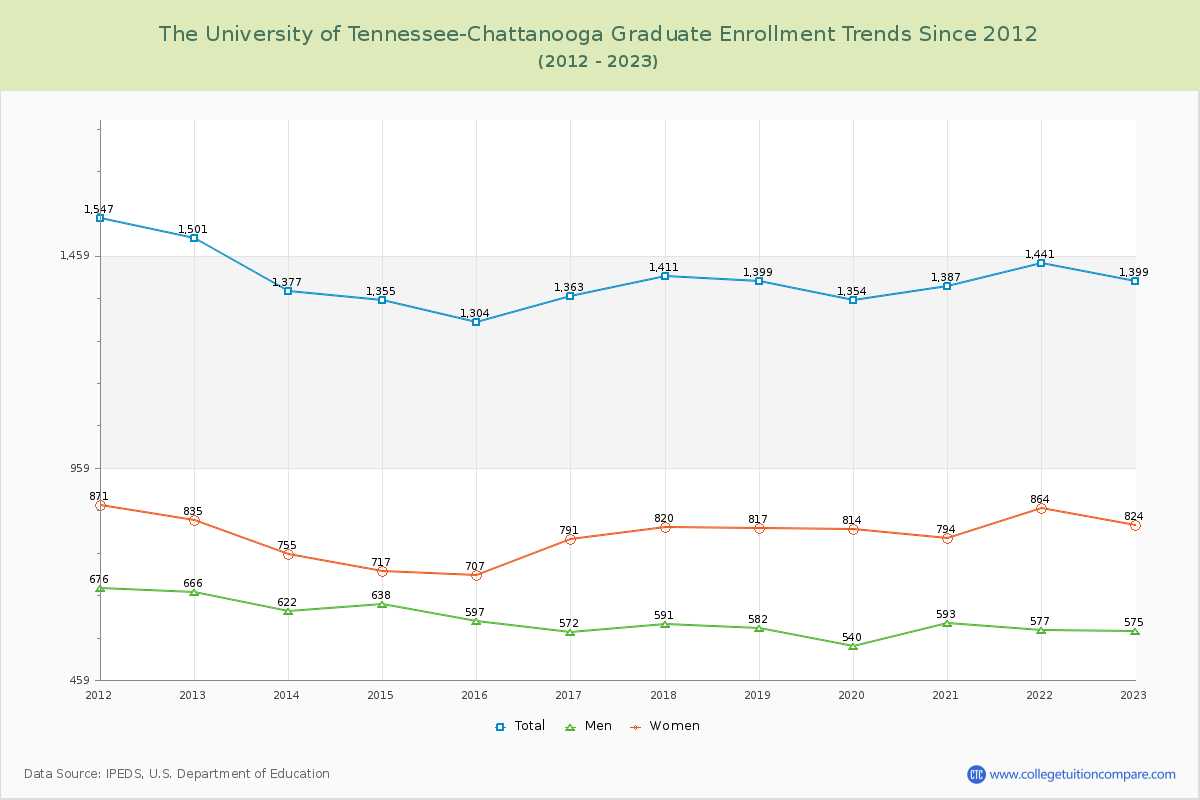
87.60% of total students is undergraduate students and 12.40% students is graduate students. The number of undergraduate students has decreased by 275 and the graduate enrollment has decreased by 102 over past 10 years.
The female to male ratio is 1.38 to 1 and it means that there are more female students enrolled in UTC than male students.
The following table and chart illustrate the changes in student population by gender at The University of Tennessee-Chattanooga since 2012.
| Year | Total | Undergraduate | Graduate | ||||
|---|---|---|---|---|---|---|---|
| Total | Men | Women | Total | Men | Women | ||
| 2012-13 | 11,660 | 10,159 | 4,555 | 5,604 | 1,501 | 666 | 835 |
| 2013-14 | 11,674 14 | 10,297 138 | 4,615 60 | 5,682 78 | 1,377 -124 | 622 -44 | 755 -80 |
| 2014-15 | 11,670 -4 | 10,315 18 | 4,591 -24 | 5,724 42 | 1,355 -22 | 638 16 | 717 -38 |
| 2015-16 | 11,387 -283 | 10,083 -232 | 4,420 -171 | 5,663 -61 | 1,304 -51 | 597 -41 | 707 -10 |
| 2016-17 | 11,533 146 | 10,170 87 | 4,513 93 | 5,657 -6 | 1,363 59 | 572 -25 | 791 84 |
| 2017-18 | 11,587 54 | 10,176 6 | 4,494 -19 | 5,682 25 | 1,411 48 | 591 19 | 820 29 |
| 2018-19 | 11,638 51 | 10,239 63 | 4,486 -8 | 5,753 71 | 1,399 -12 | 582 -9 | 817 -3 |
| 2019-20 | 11,651 13 | 10,297 58 | 4,494 8 | 5,803 50 | 1,354 -45 | 540 -42 | 814 -3 |
| 2020-21 | 11,728 77 | 10,341 44 | 4,394 -100 | 5,947 144 | 1,387 33 | 593 53 | 794 -20 |
| 2021-22 | 11,457 -271 | 10,016 -325 | 4,175 -219 | 5,841 -106 | 1,441 54 | 577 -16 | 864 70 |
| 2022-23 | 11,283 -174 | 9,884 -132 | 4,173 -2 | 5,711 -130 | 1,399 -42 | 575 -2 | 824 -40 |
| Average | 11,570 | 10,180 | 4,446 | 5,733 | 1,390 | 596 | 794 |