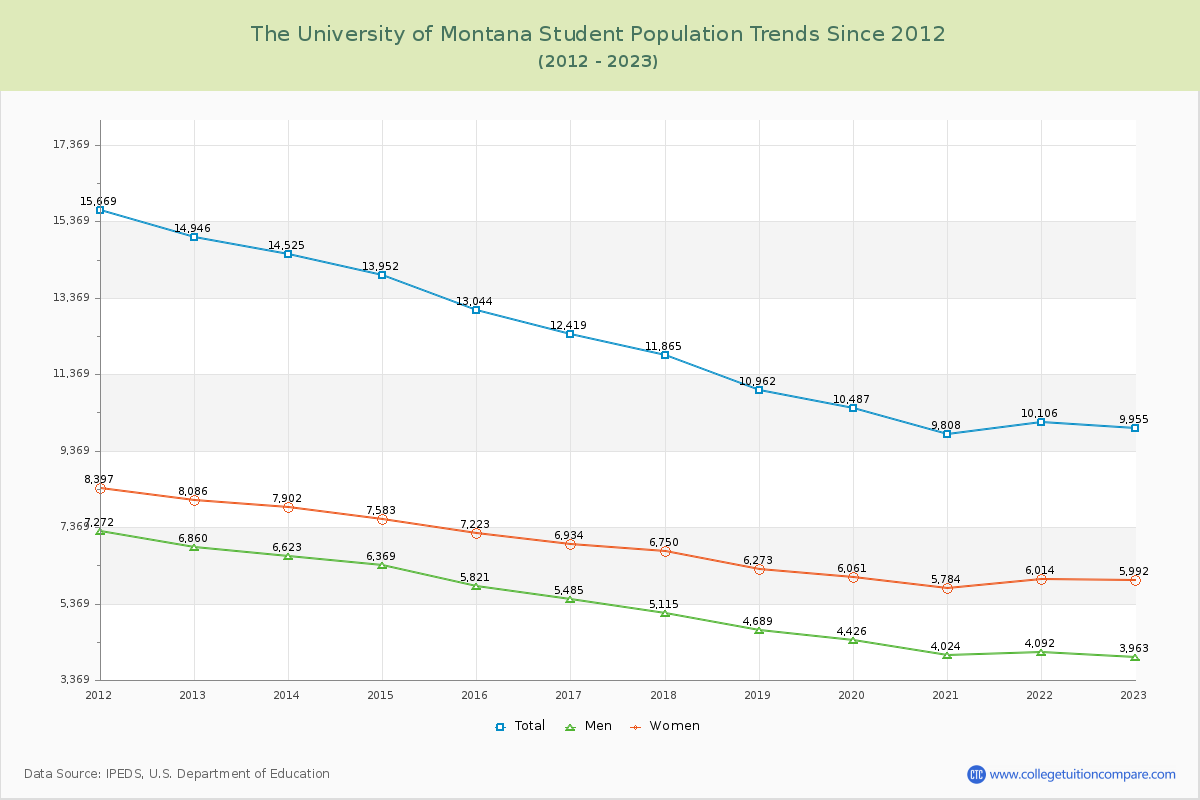
Student Population Changes
The average student population over the last 12 years is 12,006 where 9,955 students are attending the school for the academic year 2022-2023.
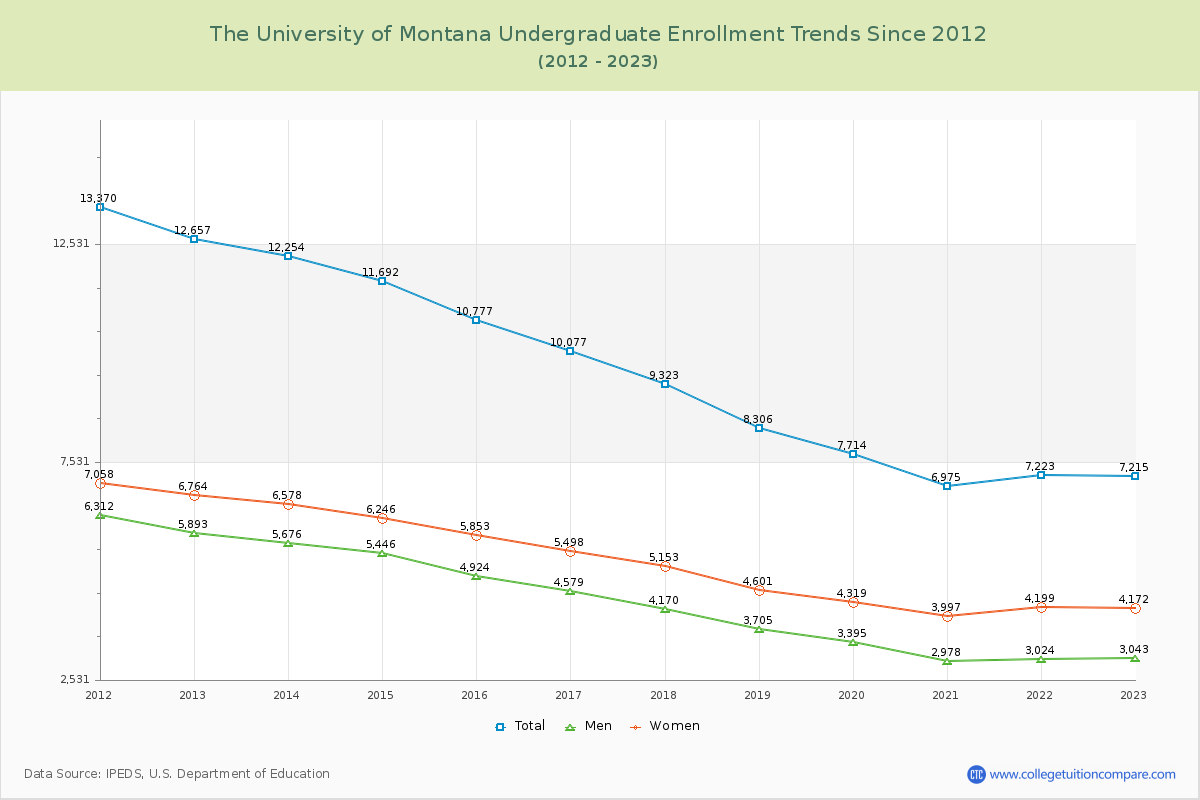
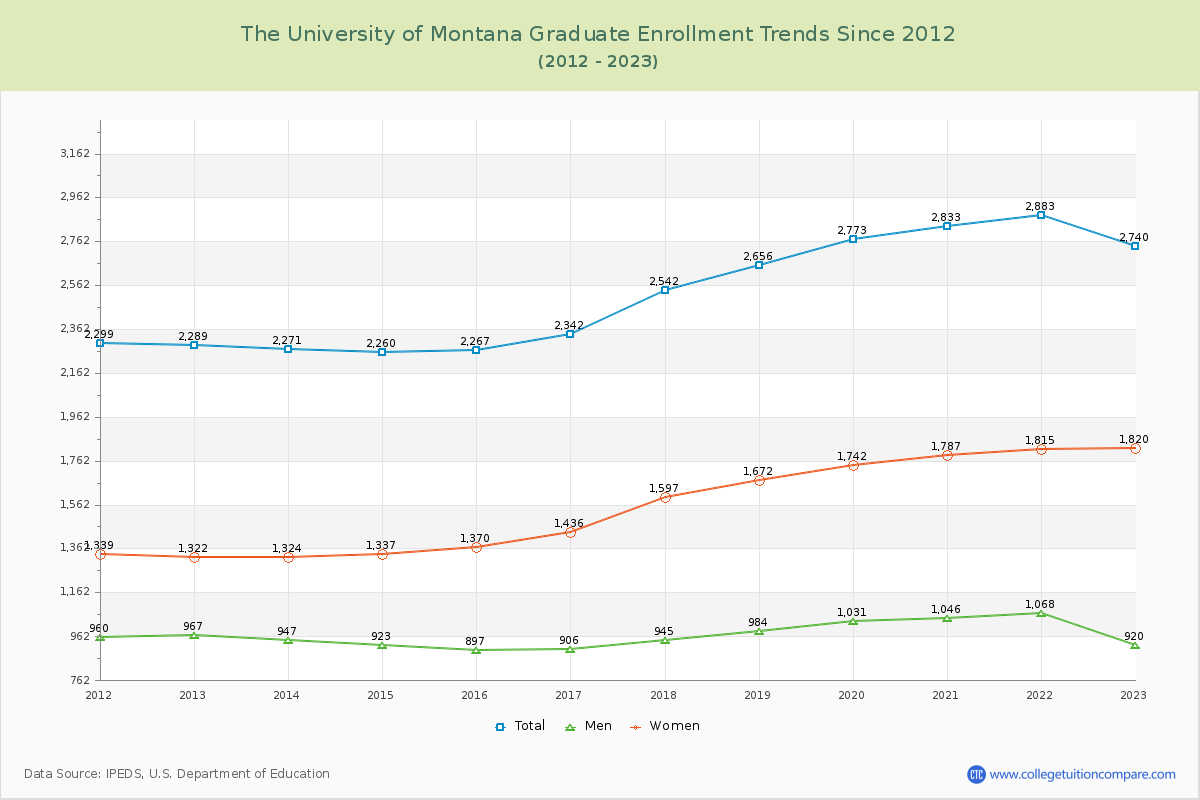
72.48% of total students is undergraduate students and 27.52% students is graduate students. The number of undergraduate students has decreased by 5,442 and the graduate enrollment has increased by 451 over past 10 years.
The female to male ratio is 1.51 to 1 and it means that there are more female students enrolled in The University of Montana than male students.
The following table and chart illustrate the changes in student population by gender at The University of Montana since 2012.
| Year | Total | Undergraduate | Graduate | ||||
|---|---|---|---|---|---|---|---|
| Total | Men | Women | Total | Men | Women | ||
| 2012-13 | 14,946 | 12,657 | 5,893 | 6,764 | 2,289 | 967 | 1,322 |
| 2013-14 | 14,525 -421 | 12,254 -403 | 5,676 -217 | 6,578 -186 | 2,271 -18 | 947 -20 | 1,324 2 |
| 2014-15 | 13,952 -573 | 11,692 -562 | 5,446 -230 | 6,246 -332 | 2,260 -11 | 923 -24 | 1,337 13 |
| 2015-16 | 13,044 -908 | 10,777 -915 | 4,924 -522 | 5,853 -393 | 2,267 7 | 897 -26 | 1,370 33 |
| 2016-17 | 12,419 -625 | 10,077 -700 | 4,579 -345 | 5,498 -355 | 2,342 75 | 906 9 | 1,436 66 |
| 2017-18 | 11,865 -554 | 9,323 -754 | 4,170 -409 | 5,153 -345 | 2,542 200 | 945 39 | 1,597 161 |
| 2018-19 | 10,962 -903 | 8,306 -1,017 | 3,705 -465 | 4,601 -552 | 2,656 114 | 984 39 | 1,672 75 |
| 2019-20 | 10,487 -475 | 7,714 -592 | 3,395 -310 | 4,319 -282 | 2,773 117 | 1,031 47 | 1,742 70 |
| 2020-21 | 9,808 -679 | 6,975 -739 | 2,978 -417 | 3,997 -322 | 2,833 60 | 1,046 15 | 1,787 45 |
| 2021-22 | 10,106 298 | 7,223 248 | 3,024 46 | 4,199 202 | 2,883 50 | 1,068 22 | 1,815 28 |
| 2022-23 | 9,955 -151 | 7,215 -8 | 3,043 19 | 4,172 -27 | 2,740 -143 | 920 -148 | 1,820 5 |
| Average | 12,006 | 9,474 | 4,258 | 5,216 | 2,532 | 967 | 1,566 |