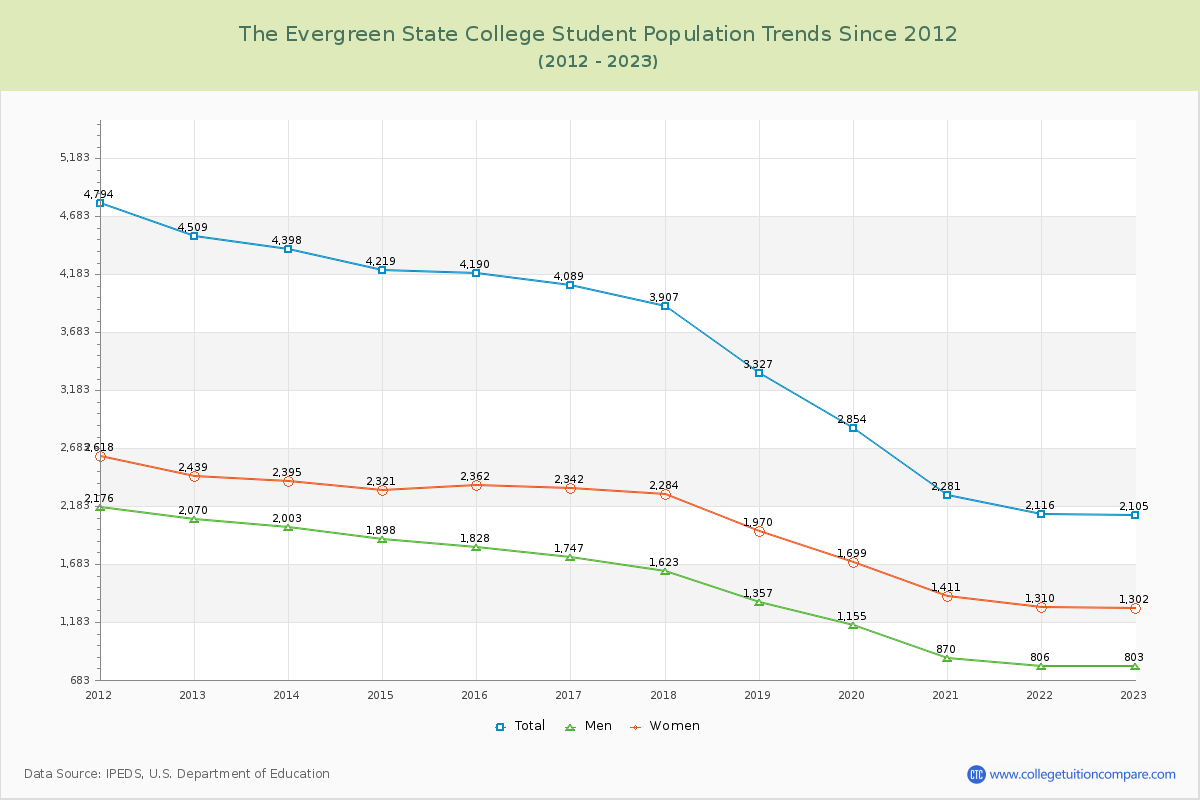
Student Population Changes
The average student population over the last 12 years is 3,454 where 2,105 students are attending the school for the academic year 2022-2023.
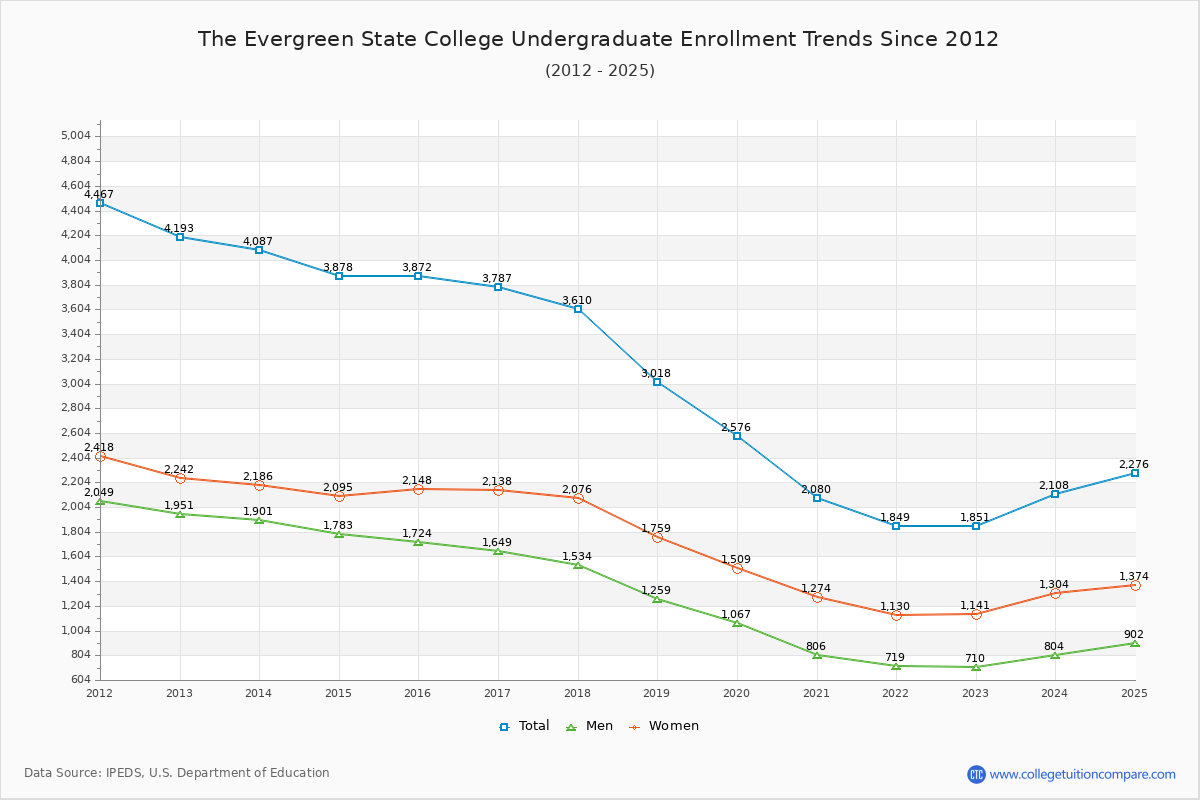
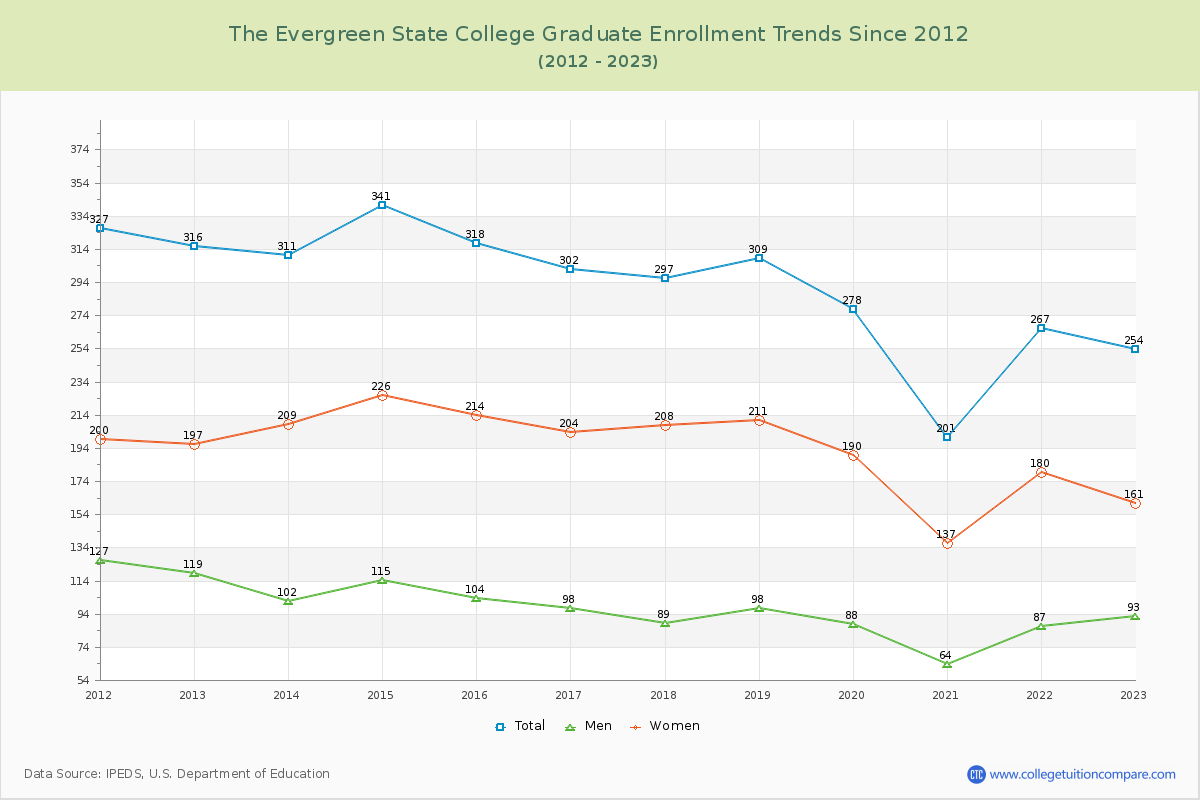
87.93% of total students is undergraduate students and 12.07% students is graduate students. The number of undergraduate students has decreased by 2,342 and the graduate enrollment has decreased by 62 over past 10 years.
The female to male ratio is 1.62 to 1 and it means that there are more female students enrolled in TESC than male students.
The following table and chart illustrate the changes in student population by gender at The Evergreen State College since 2012.
| Year | Total | Undergraduate | Graduate | ||||
|---|---|---|---|---|---|---|---|
| Total | Men | Women | Total | Men | Women | ||
| 2012-13 | 4,509 | 4,193 | 1,951 | 2,242 | 316 | 119 | 197 |
| 2013-14 | 4,398 -111 | 4,087 -106 | 1,901 -50 | 2,186 -56 | 311 -5 | 102 -17 | 209 12 |
| 2014-15 | 4,219 -179 | 3,878 -209 | 1,783 -118 | 2,095 -91 | 341 30 | 115 13 | 226 17 |
| 2015-16 | 4,190 -29 | 3,872 -6 | 1,724 -59 | 2,148 53 | 318 -23 | 104 -11 | 214 -12 |
| 2016-17 | 4,089 -101 | 3,787 -85 | 1,649 -75 | 2,138 -10 | 302 -16 | 98 -6 | 204 -10 |
| 2017-18 | 3,907 -182 | 3,610 -177 | 1,534 -115 | 2,076 -62 | 297 -5 | 89 -9 | 208 4 |
| 2018-19 | 3,327 -580 | 3,018 -592 | 1,259 -275 | 1,759 -317 | 309 12 | 98 9 | 211 3 |
| 2019-20 | 2,854 -473 | 2,576 -442 | 1,067 -192 | 1,509 -250 | 278 -31 | 88 -10 | 190 -21 |
| 2020-21 | 2,281 -573 | 2,080 -496 | 806 -261 | 1,274 -235 | 201 -77 | 64 -24 | 137 -53 |
| 2021-22 | 2,116 -165 | 1,849 -231 | 719 -87 | 1,130 -144 | 267 66 | 87 23 | 180 43 |
| 2022-23 | 2,105 -11 | 1,851 2 | 710 -9 | 1,141 11 | 254 -13 | 93 6 | 161 -19 |
| Average | 3,454 | 3,164 | 1,373 | 1,791 | 290 | 96 | 194 |