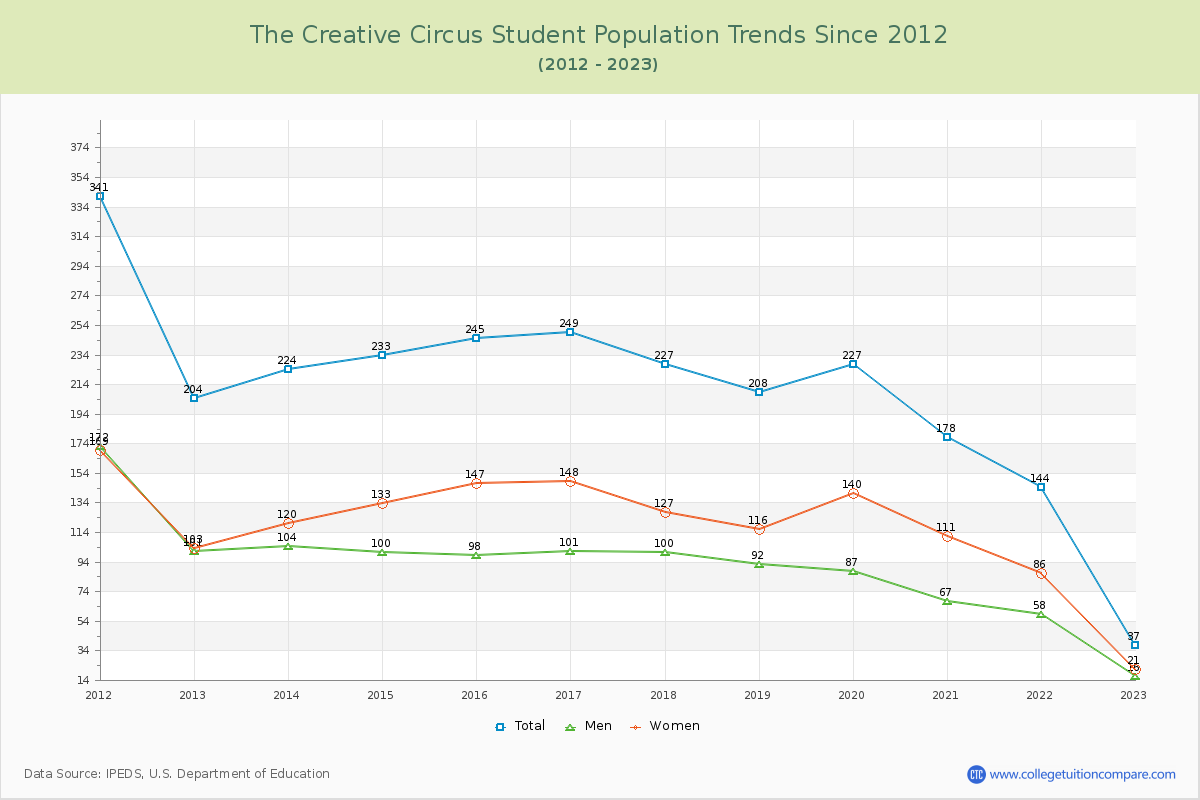
Student Population Changes
The average student population over the last 12 years is 198 where 37 students are attending the school for the academic year 2022-2023.
The female to male ratio is 1.31 to 1 and it means that there are more female students enrolled in The Creative Circus than male students.
The following table and chart illustrate the changes in student population by gender at The Creative Circus since 2012.
| Year | Total | Men | Women |
|---|---|---|---|
| 2012-13 | 204 | 101 | 103 |
| 2013-14 | 224 20 | 104 3 | 120 17 |
| 2014-15 | 233 9 | 100 -4 | 133 13 |
| 2015-16 | 245 12 | 98 -2 | 147 14 |
| 2016-17 | 249 4 | 101 3 | 148 1 |
| 2017-18 | 227 -22 | 100 -1 | 127 -21 |
| 2018-19 | 208 -19 | 92 -8 | 116 -11 |
| 2019-20 | 227 19 | 87 -5 | 140 24 |
| 2020-21 | 178 -49 | 67 -20 | 111 -29 |
| 2021-22 | 144 -34 | 58 -9 | 86 -25 |
| 2022-23 | 37 -107 | 16 -42 | 21 -65 |
| Average | 198 | 84 | 114 |