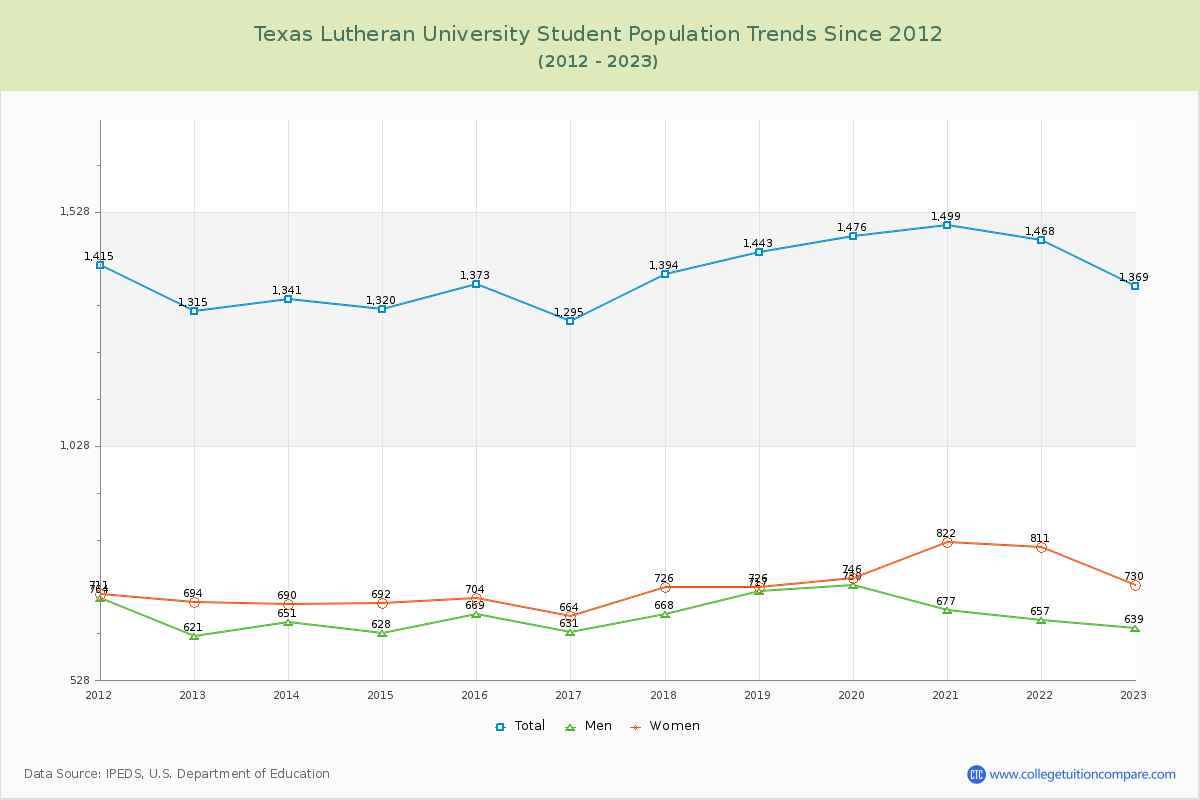
Student Population Changes
The average student population over the last 12 years is 1,390 where 1,369 students are attending the school for the academic year 2022-2023.
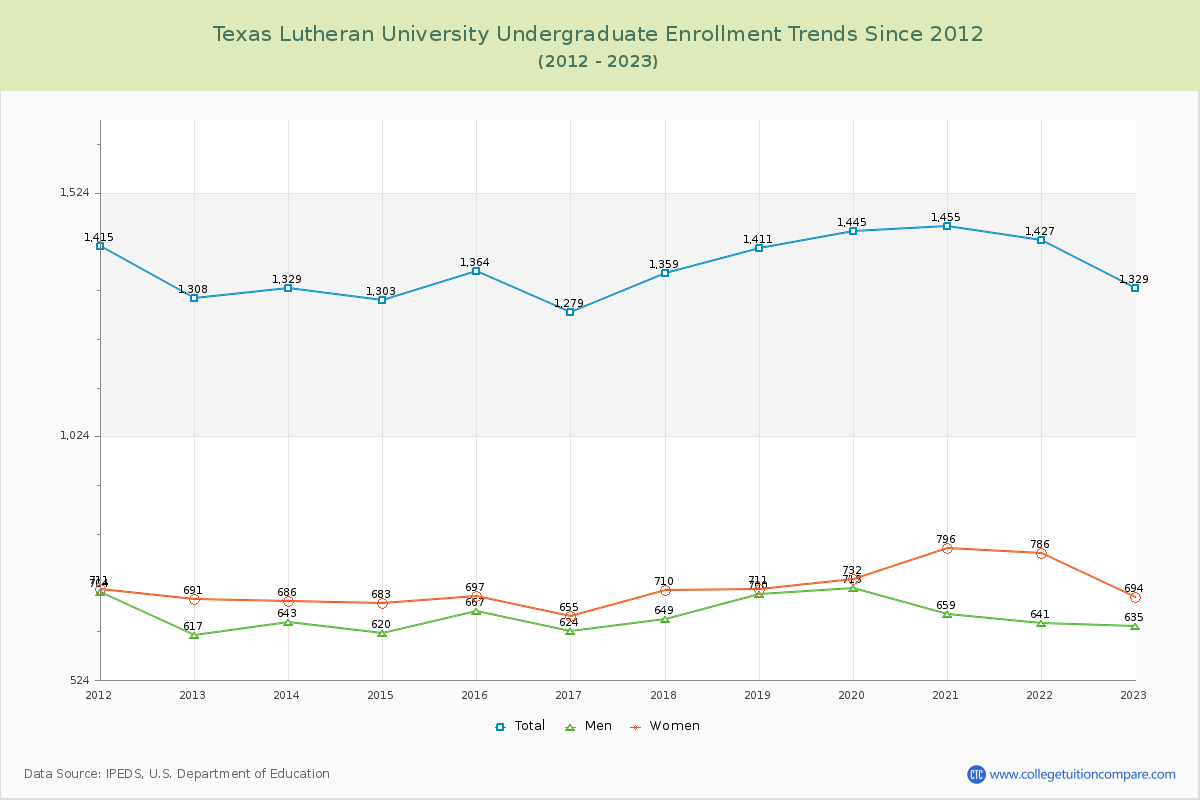
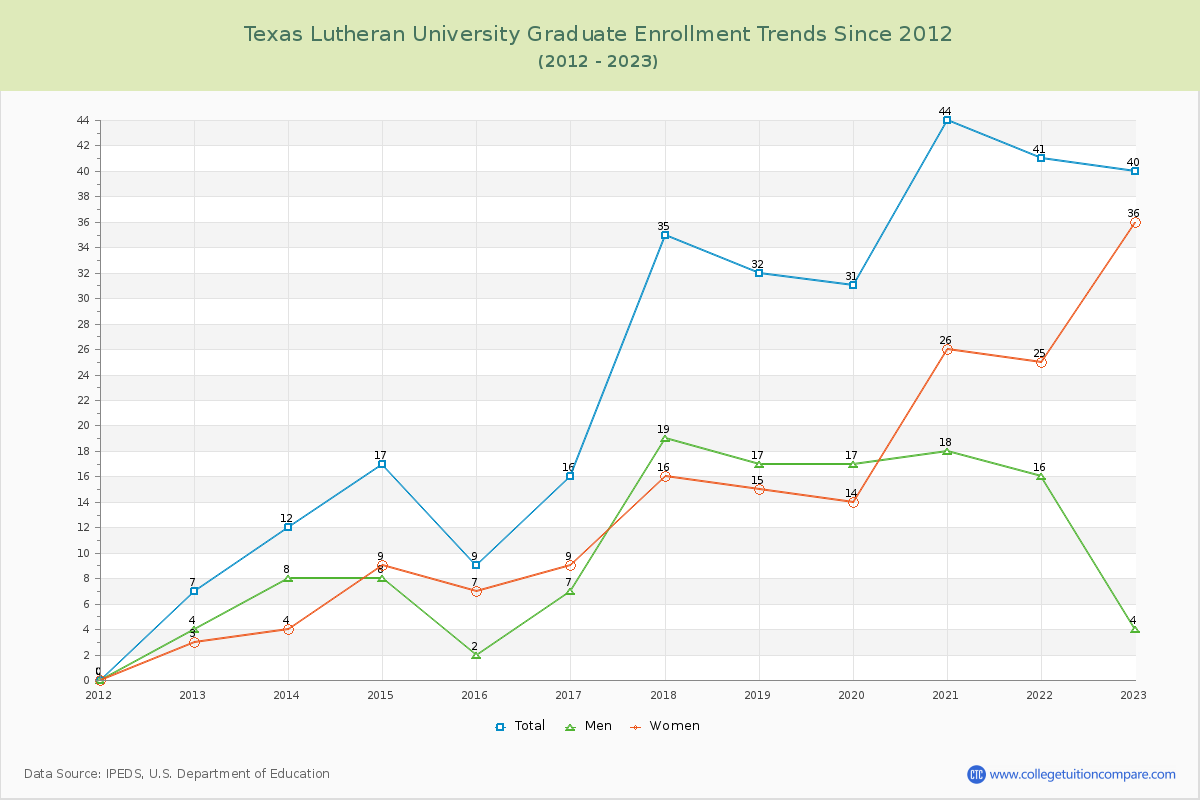
97.08% of total students is undergraduate students and 2.92% students is graduate students. The number of undergraduate students has increased by 21 and the graduate enrollment has increased by 33 over past 10 years.
The female to male ratio is 1.14 to 1 and it means that there are slightly more female students enrolled in TLU than male students.
The following table and chart illustrate the changes in student population by gender at Texas Lutheran University since 2012.
| Year | Total | Undergraduate | Graduate | ||||
|---|---|---|---|---|---|---|---|
| Total | Men | Women | Total | Men | Women | ||
| 2012-13 | 1,315 | 1,308 | 617 | 691 | 7 | 4 | 3 |
| 2013-14 | 1,341 26 | 1,329 21 | 643 26 | 686 -5 | 12 5 | 8 4 | 4 1 |
| 2014-15 | 1,320 -21 | 1,303 -26 | 620 -23 | 683 -3 | 17 5 | 8 0 | 9 5 |
| 2015-16 | 1,373 53 | 1,364 61 | 667 47 | 697 14 | 9 -8 | 2 -6 | 7 -2 |
| 2016-17 | 1,295 -78 | 1,279 -85 | 624 -43 | 655 -42 | 16 7 | 7 5 | 9 2 |
| 2017-18 | 1,394 99 | 1,359 80 | 649 25 | 710 55 | 35 19 | 19 12 | 16 7 |
| 2018-19 | 1,443 49 | 1,411 52 | 700 51 | 711 1 | 32 -3 | 17 -2 | 15 -1 |
| 2019-20 | 1,476 33 | 1,445 34 | 713 13 | 732 21 | 31 -1 | 17 0 | 14 -1 |
| 2020-21 | 1,499 23 | 1,455 10 | 659 -54 | 796 64 | 44 13 | 18 1 | 26 12 |
| 2021-22 | 1,468 -31 | 1,427 -28 | 641 -18 | 786 -10 | 41 -3 | 16 -2 | 25 -1 |
| 2022-23 | 1,369 -99 | 1,329 -98 | 635 -6 | 694 -92 | 40 -1 | 4 -12 | 36 11 |
| Average | 1,390 | 1,364 | 652 | 713 | 26 | 11 | 15 |