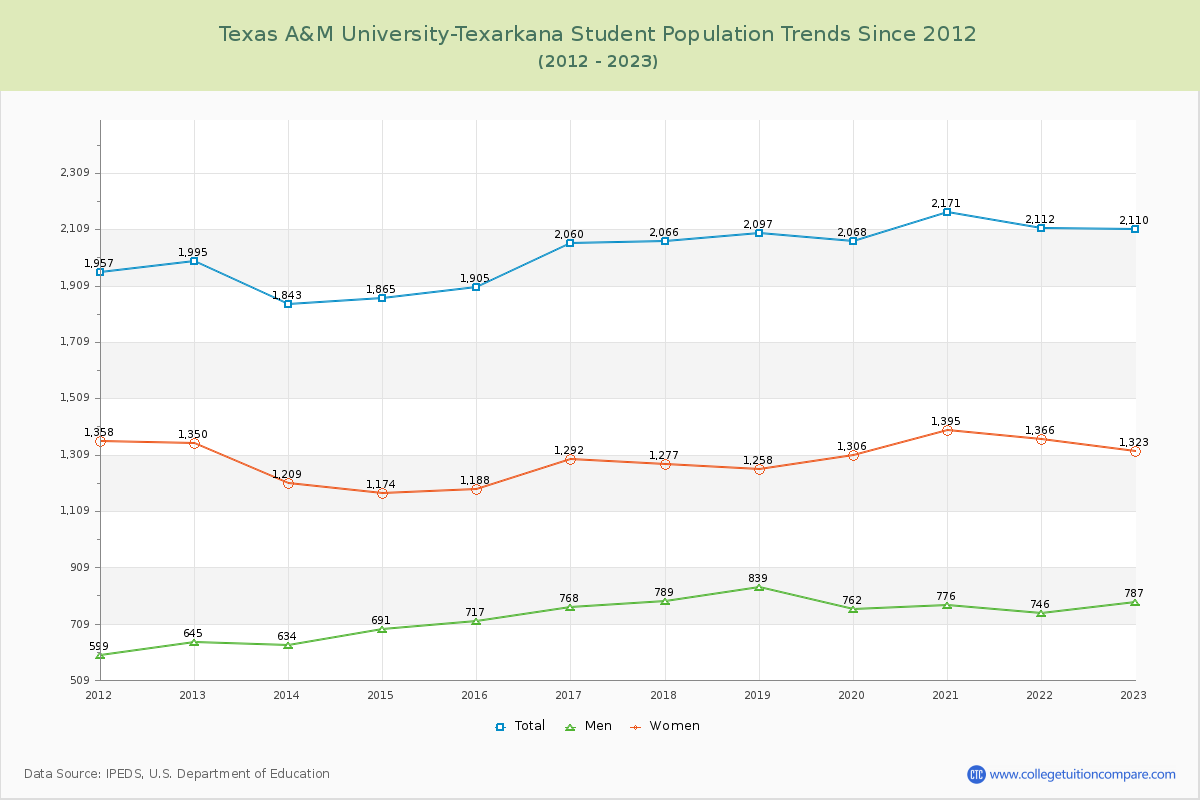
Student Population Changes
The average student population over the last 12 years is 2,027 where 2,110 students are attending the school for the academic year 2022-2023.
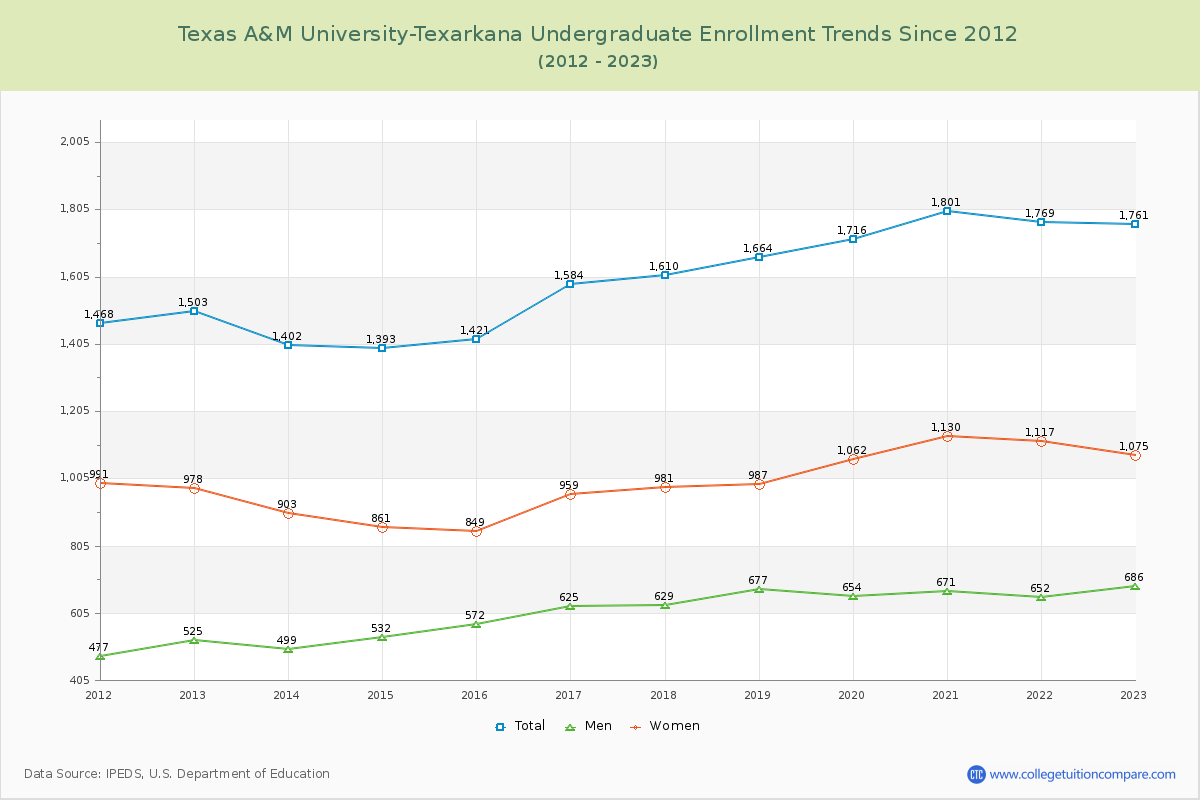
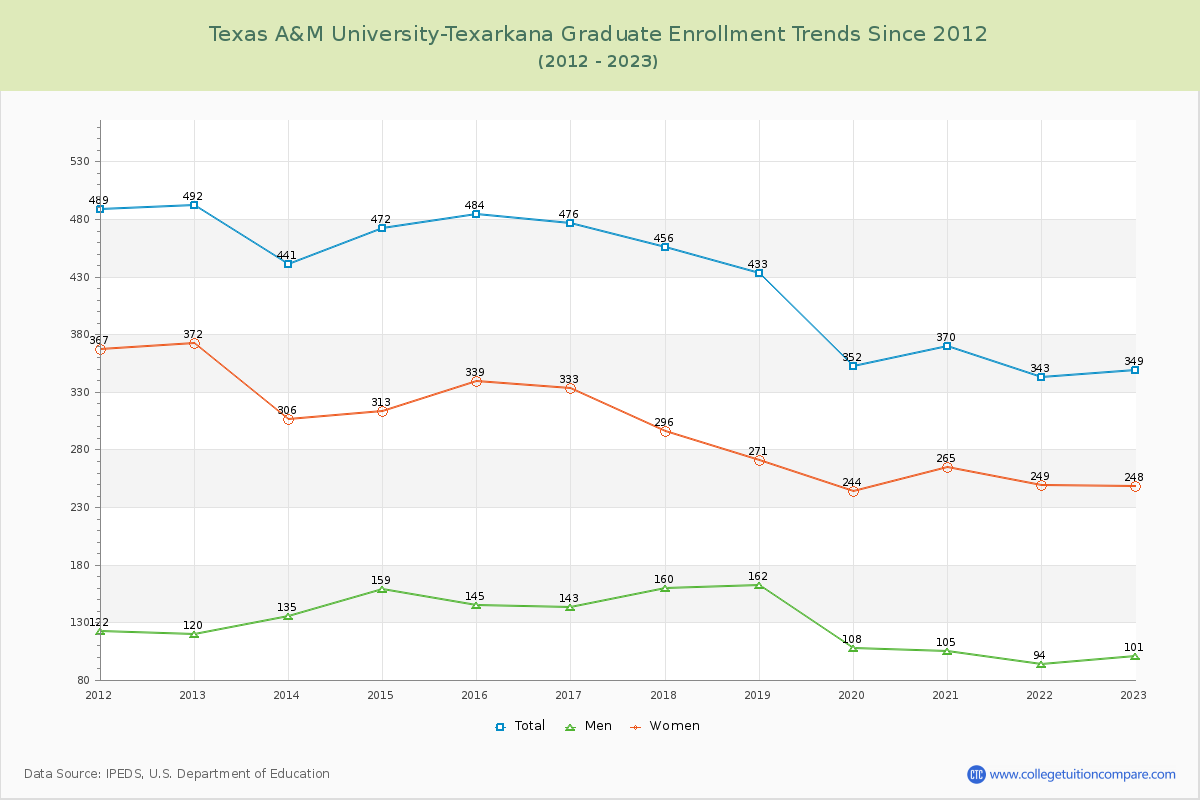
83.46% of total students is undergraduate students and 16.54% students is graduate students. The number of undergraduate students has increased by 258 and the graduate enrollment has decreased by 143 over past 10 years.
The female to male ratio is 1.68 to 1 and it means that there are more female students enrolled in TAMU-Texarkana than male students.
The following table and chart illustrate the changes in student population by gender at Texas A&M University-Texarkana since 2012.
| Year | Total | Undergraduate | Graduate | ||||
|---|---|---|---|---|---|---|---|
| Total | Men | Women | Total | Men | Women | ||
| 2012-13 | 1,995 | 1,503 | 525 | 978 | 492 | 120 | 372 |
| 2013-14 | 1,843 -152 | 1,402 -101 | 499 -26 | 903 -75 | 441 -51 | 135 15 | 306 -66 |
| 2014-15 | 1,865 22 | 1,393 -9 | 532 33 | 861 -42 | 472 31 | 159 24 | 313 7 |
| 2015-16 | 1,905 40 | 1,421 28 | 572 40 | 849 -12 | 484 12 | 145 -14 | 339 26 |
| 2016-17 | 2,060 155 | 1,584 163 | 625 53 | 959 110 | 476 -8 | 143 -2 | 333 -6 |
| 2017-18 | 2,066 6 | 1,610 26 | 629 4 | 981 22 | 456 -20 | 160 17 | 296 -37 |
| 2018-19 | 2,097 31 | 1,664 54 | 677 48 | 987 6 | 433 -23 | 162 2 | 271 -25 |
| 2019-20 | 2,068 -29 | 1,716 52 | 654 -23 | 1,062 75 | 352 -81 | 108 -54 | 244 -27 |
| 2020-21 | 2,171 103 | 1,801 85 | 671 17 | 1,130 68 | 370 18 | 105 -3 | 265 21 |
| 2021-22 | 2,112 -59 | 1,769 -32 | 652 -19 | 1,117 -13 | 343 -27 | 94 -11 | 249 -16 |
| 2022-23 | 2,110 -2 | 1,761 -8 | 686 34 | 1,075 -42 | 349 6 | 101 7 | 248 -1 |
| Average | 2,027 | 1,602 | 611 | 991 | 424 | 130 | 294 |