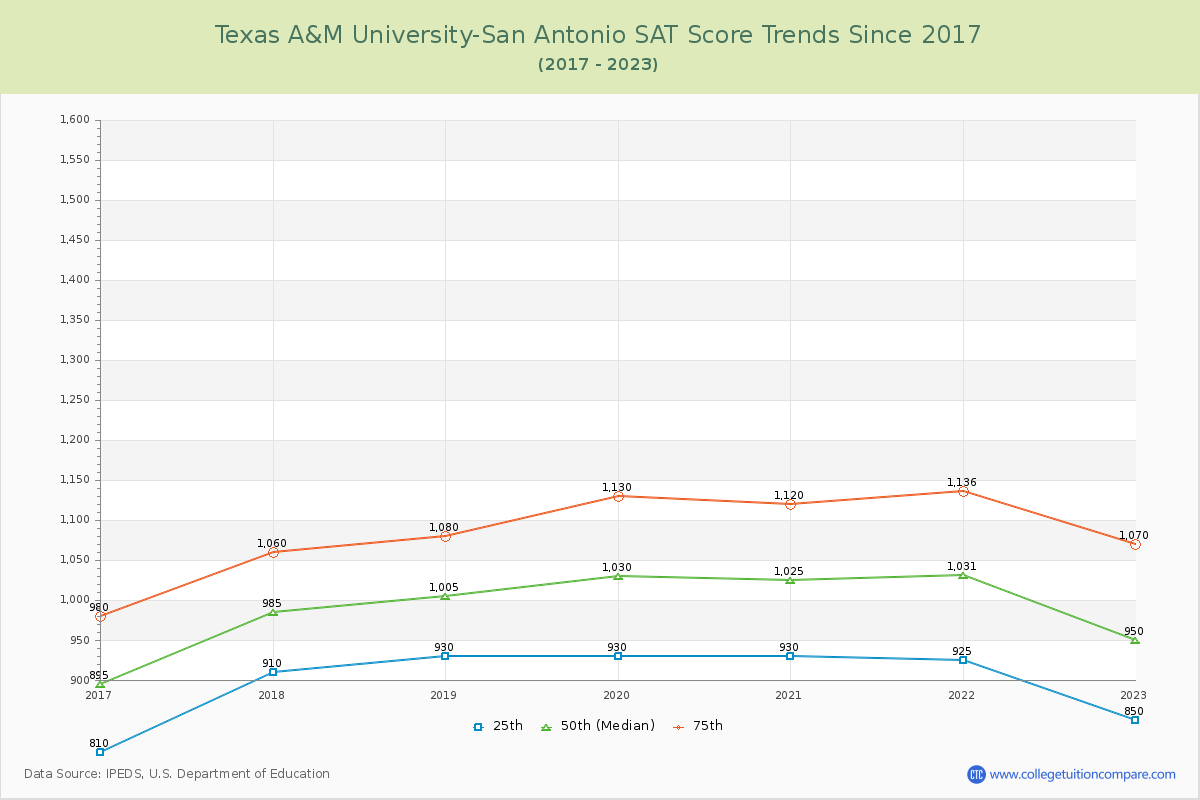
SAT Scores Over Time
The 2023 SAT score is 950 at TAMU-San Antonio. Over the past 8 years, the average SAT score is 898 (25th percentile) and 1082 (75th percentile). Compared to similar schools, the submitted SAT scores are around national average at TAMU-San Antonio.
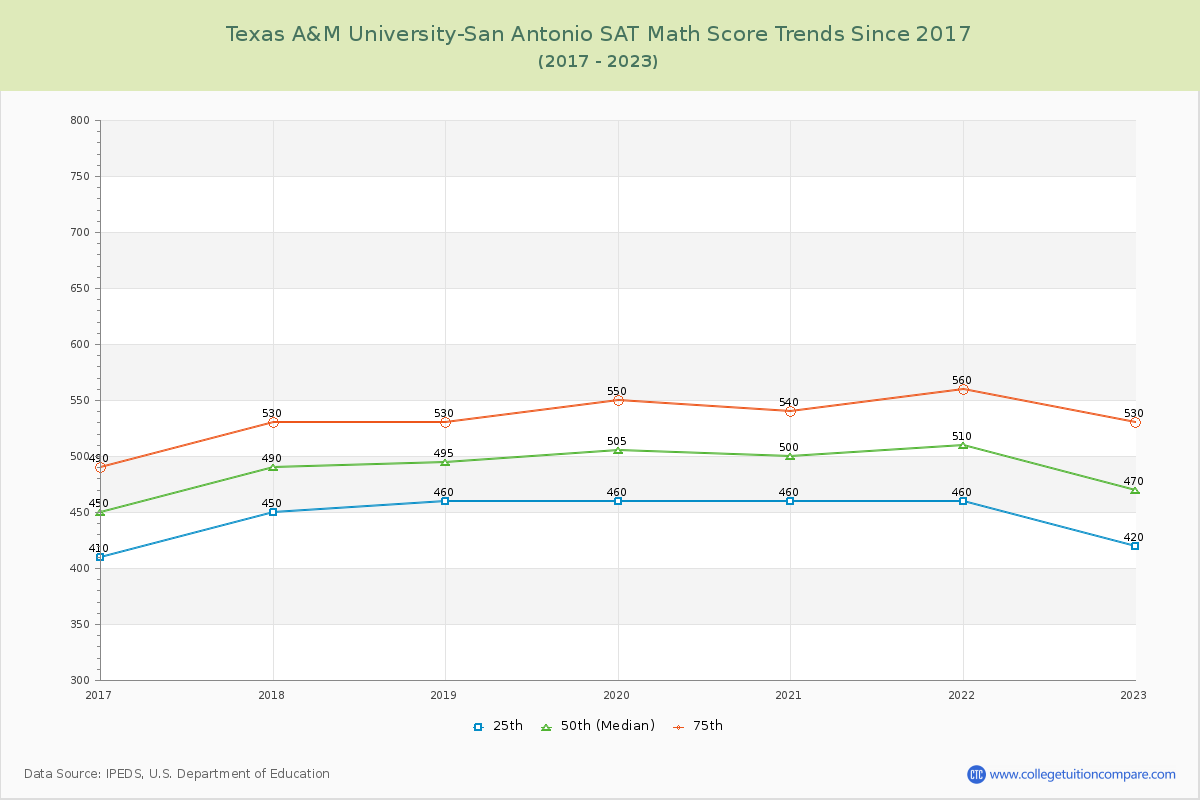
The following table and chart illustrate the changes in SAT scores at Texas A&M University-San Antonio since 2016.
| Year | Total | Math | Evidence-Based Reading and Writing | ||||||
|---|---|---|---|---|---|---|---|---|---|
| 25th | 50th | 75th | 25th | 50th | 75th | 25th | 50th | 75th | |
| 2016-17 | 810 | 895 | 980 | 410 | 450 | 490 | 400 | 445 | 490 |
| 2017-18 | 910 | 985 | 1,060 | 450 | 490 | 530 | 460 | 495 | 530 |
| 2018-19 | 930 | 1,005 | 1,080 | 460 | 495 | 530 | 470 | 510 | 550 |
| 2019-20 | 930 | 1,030 | 1,130 | 460 | 505 | 550 | 470 | 525 | 580 |
| 2020-21 | 930 | 1,025 | 1,120 | 460 | 500 | 540 | 470 | 525 | 580 |
| 2021-22 | 925 | 1,031 | 1,136 | 460 | 510 | 560 | 465 | 521 | 576 |
| 2022-23 | 850 | 950 | 1,070 | 420 | 470 | 530 | 430 | 480 | 540 |
| Average | 898 | 989 | 1082 | 446 | 489 | 533 | 452 | 500 | 549 |
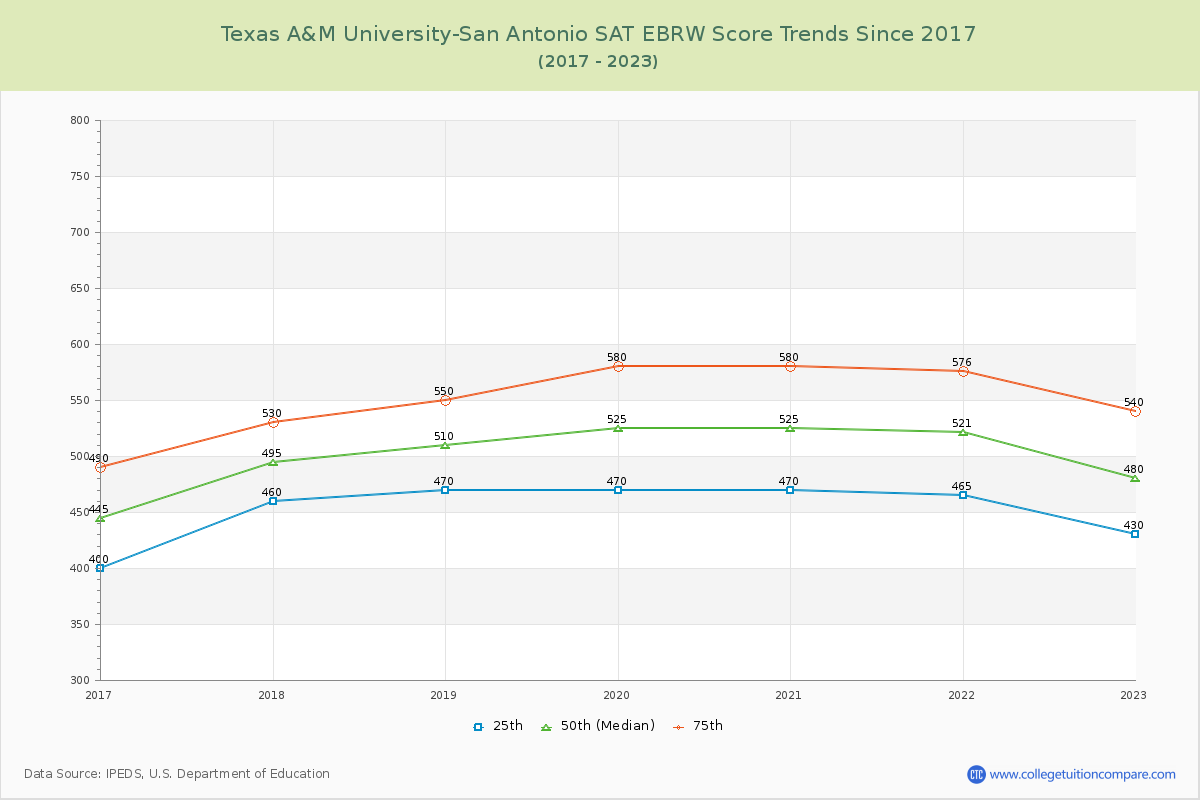
*SAT Evidence-Based Reading and Writing replaces SAT critical reading and writing since year 2017.
**The SAT Writing score is excluded from the total scores for year from 2011 to 2016.